Odor intensity level
Level description
0
No odor
1
Barley noticeable odor
2
Slight but clearly noticeable odor
3
Moderate odor
4
Strong odor
5
Extremely strong odor
Generally, the odor judge or panelist evaluates the odor by sniffing the exhaled air at a fixed distance (10 cm) from the subject’s mouth, and scoring the odor according to the scale (Fig. 8.1). This can be done directly from the subject’s mouth (e.g., during exhalation, speech – “count to 20”, blowing through a straw), or indirectly using a sampling bag. A partition screen is sometimes employed to blind the odor judge to the subject’s appearance (Murata et al. 2002).


Fig. 8.1
Organoleptic (odor judge) assessment of breath odor
In our initial studies, we adopted the ‘forced choice’ approach, i.e., the judge is forced to choose one of the 0–5 categories (Rosenberg et al. 1991a). But during the research, we sometimes faced dilemmas. How does one score the level of an odor that is somewhere between slight and moderate? One possibility was to use a visual analogue scale that is often used in perception studies, for example, to register the level of pain. In such instances, the judge has the option of drawing the line anywhere along the scale. We used this approach in one study, allowing the odor judge to score anywhere on a scale of 0 (no odor) to 10 (unbearably strong odor) (Goldberg et al. 1994). Since the scoring on such a scale is ostensibly linear and continuous, statistic analysis based on linear data can be more readily justified.
In subsequent studies, we used a similar approach. We went back to the six-point descriptive scale, but allowed judges to score at will in between the finite descriptors (e.g., give a score of 2.5, between slight and moderate) (Greenstein et al. 1997). When the sample size is large (e.g., n = 100), the results approximate data obtained using a continuous scale. Analysis using statistical tools developed for studying continuous data (e.g., linear regression analysis, Pearson correlation coefficients) can then be employed with greater confidence.
Interpersonal variation in odor perception between odor judges still remains a major problem (Rosenberg et al. 1991b). In order to try and standardize odor judge scoring, calibration and training methods have been proposed. Odor judge training protocol based on the American Society of Testing and Materials Standards (introduction to sensory scales, use of n-butanol reference and sniffing techniques) was shown to reduce odor judge errors (Nachnani et al. 2005).
Dilution methods are usually device dependent. They are based on an apparatus or instrument designed to mix and dilute the odor sample to a set of concentrations enabling the judge to determine the minimal odor detectability or odor threshold. Some of these devices are handheld and used in field studies (e.g., olfactometer). In early studies on oral malodor done by Fosdick and colleagues, they reported the use of a device called the osmoscope as a sample dilution method designed to determine odor intensity (Brening et al. 1939).
Recently, a non-apparatus-dependent dilution method was reported (Bornstein et al. 2009). This method relies on the distance between the odor judge’s nose and the patient’s mouth as the diluting factor (i.e., 1 m, 30 and 10 cm) assuming that a higher intensity malodor would be sensed from a greater distance. Although organoleptic scales (continuous as possible) are more robust for research, this simple method was deemed suitable for a clinical setting.
Instrumental Measuring of Malodor-Related Compounds
Gas Chromatography (GC)
The need for objective, quantitative techniques to serve as auxiliary tests for the organoleptic measurement for both research and the clinic led to the development of various instrumental measuring techniques.
The use of gas chromatography for the quantification of volatile sulfide compounds (VSC) in mouth air was first reported by Tonzetich in the early 1970s (Tonzetich 1971). Since then, many studies have employed this method and reported significant correlations between GC measurements of VSC and malodor levels as evaluated organoleptically by odor judges (Table 8.2).
Table 8.2
Association between gas chromatography measurement of mouth air VSC levels and oral malodor scores
|
Reference
|
Parameters
|
Correlations
|
|---|---|---|
|
Schmidt et al. (1978) (n = 102)
|
Odor judge scores (0–3; 3 judges)
Study I (n = 36)
Study II (n = 66)
|
Kendall correlation
r = 0.28, p < 0.05
r = 0.35, p < 0.001
|
|
Shimura et al. (1996) (n = 21)
|
Odor judge scores (0–4; 3 judges)
|
Pearson correlation
r = 0.71, p < 0.01
|
|
Oho et al. (2001) (n = 155)
|
Odor judge scores (0–3; 3 judges)
|
Spearman correlation
r = 0.69, p < 0.0001
|
|
Amano et al. (2002) (n = 61)
|
Odor judge scores (0–3; 3 judges)
|
Spearman correlation
r = 0.47, p < 0.01
|
|
Tanaka et al. (2004b) (n = 78)
|
Odor judge scores (0–5; 1 judge)
|
Spearman correlation
r = 0.63, p < 0.05
|
|
Awano et al. (2004) (n = 127)
|
Odor judge scores (0–5; 3 judges)
CH3SH
H2S
Total VSC
|
Spearman correlation
r = 0.75, p < 0.001
r = 0.59, p < 0.001
r = 0.74, p < 0.001
|
|
Nonaka et al. (2005) (n = 66)
|
Odor judge scores (not specified)
|
Correlation (not specified)
r = 0.73, p– not specified
|
|
Hunter et al. (2005) (n = 25)
|
Odor judge scores (0–5; 2 judges)
CH3SH
H2S
Total VSC
|
Pearson correlation
r = 0.61, p < 0.001
r = 0.63, p < 0.001
r = 0.65, p < 0.001
|
Traditional GC has a few distinctive disadvantages such as being time consuming, costly, and requiring a professional technician for operation; conversely, it allows for the detection and quantitation of specific compounds. This feature has helped in the identification of various compounds present in mouth air and breath samples (see Chap. 3) and may help identify the role of specific volatiles in malodor of various origins. For example, whereas hydrogen sulfide is produced largely from the tongue dorsum, methyl mercaptan is elevated in cases with periodontitis (Yaegaki and Sanada 1992). Furthermore, other non-sulfide compounds detected by GC (e.g., pyridine, picoline) were also associated with the presence of periodontal disease (Kostelc et al. 1981).
The technical complexity of GC along with the other drawbacks had limited its application mainly to research and rendered it unsuitable for the clinic. However, recent attempts to simplify this system have resulted in a simpler instrument suitable for the clinical setting (Murata et al. 2006).
Sulfide Monitor
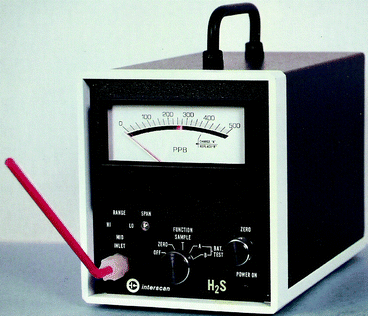
In the early 1990s, Rosenberg and coworkers suggested the use of a portable sulfide monitor, originally designed for ambient air quality measurement in working and living environments (Fig. 8.2), for the measurement of sulfide levels in mouth air (Rosenberg et al. 1991a, b). Although this device measures the total concentration of volatile sulfide compounds and does not distinguish between the individual sulfide compounds, its readings correlate significantly with odor judge scores in numerous studies (Table 8.3).


Fig. 8.2
Sulfide monitor (Interscan corp. CA) 1170 series
Table 8.3
Association between sulfide monitor (Halimeter) measurement of mouth air VSC levels and oral malodor scores
|
Reference
|
Parameters
|
Correlations
|
|---|---|---|
|
Rosenberg et al. (1991b) (n = 75)
|
Odor judge scores (0–5; 7 judges)
|
Spearman correlation
|
|
r = 0.60, p < 0.001
|
||
|
Rosenberg et al. (1991a) (n = 41)
|
Odor judge scores (0–5; 2 judges)
Odor judge 1
Odor judge 2
|
Pearson correlation
r = 0.55, p < 0.0001
r = 0.43, p < 0.0001
|
|
De Boever et al. (1994) (n = 55)
|
Odor judge scores (0–4; 1 judge)
|
Pearson correlation
|
|
r = 0.63, p < 0.001
|
||
|
Kozlovsky et al. (1994) (n = 52)
|
Odor judge scores (10 cm continuous scale; 1 judge)
|
Pearson correlation
|
|
r = 0.47, p < 0.001
|
||
|
Greenstein et al. (1997) (n = 123)
|
Odor judge scores (0–5; 2 judges)
Odor judge 1
Odor judge 2
|
Pearson correlation
r = 0.27, p = 0.003
r = 0.39, p < 0.001
|
|
Willis et al. (1999) (n = 30)
|
Odor judge scores (0–10; 3 judges)
|
Pearson correlation
|
|
r = 0.41, p = 0.027
|
||
|
Oho et al. (2001) (n = 155)
|
Odor judge scores (0–3; 3 judges)
|
Spearman correlation
|
|
r = 0.66, p < 0.0001
|
||
|
Sterer et al. (2002) (n = 64)
|
Odor judge scores (0–5; 2 judges)
Odor judge 1
Odor judge 2
|
Spearman correlation
r = 0.37, p = 0.002
r = 0.46, p < 0.001
|
|
Iwanicka-Grzegorek et al. (2005) (n = 124)
|
Odor judge scores (0–5; 3 judges)
|
Spearman correlation
|
|
r = 0.78, p < 0.001
|
||
|
Stamou et al. (2005) (n = 71)
|
Odor judge scores (0–5; 1 judge)
|
Pearson correlation
|
|
r = 0.59, p < 0.001
|
||
|
Sterer et al. (2008) (n = 42)
|
Odor judge scores (0–5; 2 judges)
|
Spearman correlation
|
|
r = 0.66, p < 0.001
|
||
|
Vandekerckhove et al. (2009) (n = 280)
|
Odor judge scores (0–5; 1 judge)
|
Spearman correlation
|
|
r = 0.74, p < 0.01
|
Its simple operation, small size, rapid sample analysis, and relatively low cost made the sulfide monitor the most popular means for VSC measurements in both research and clinical settings. Furthermore, in studies carried out using both GC and sulfide monitor for measuring oral VSCs levels (Furne et al. 2002; Oho et al. 2001), the two correlated significantly with one another, yielding correlation coefficients of 0.73 (p < 0.01) and 0.84 (p < 0.0001).
Measuring Techniques of Malodor-Related Compounds
Other measuring techniques for the detection of VSC as well as other malodor-related compounds (e.g., ammonia, amines) have been reported in the literature (Table 8.4). These include various techniques ranging from simple colorimetric assays and small portable semiconductor-based sulfide monitors to more complex methods involving elaborate laboratory equipment such as chemical sensors array and high-performance liquid chromatography.
Table 8.4
Association between malodor-related compounds measurement (chemical sensors, gas detectors, colorimetric assays, and chromatography) and oral malodor scores
|
Reference
|
Compounds
|
Method
|
Correlations with malodor
|
|---|---|---|---|
|
Goldberg et al. (1994) (n = 52)
|
Cadaverine
|
High performance liquid chromatography (HPLC)
|
Pearson correlation
r = 0.37, p = 0.027
|
|
Shimura et al. (1997) (n = 94)
|
VSC
|
Portable monitor with a zinc-oxide thin-film semiconductor sensor
|
Pearson correlation
r = 0.82, p < 0.01
|
|
Morita et al. (2001) (n = 20)
|
Sulfide ions
|
Sulfide electrode tongue probe
|
Spearman correlation
r = 0.77, p < 0.01
|
|
Amano et al. (2002) (n = 61)
|
Ammonia
|
Portable ammonia-monitoring device
|
Pearson correlation
r = 0.16, NS
|
|
Tanaka et al. (2004a) (n = 78)
|
Volatiles (low boiling point)
|
Chemical sensor array (“electronic nose”)
|
Spearman correlation
r = 0.71, p < 0.05
|
|
Iwanicka-Grzegorek et al. (2005) (n = 124)
|
Salivary amines (low molecular weight)
|
Ninhydrin method
|
Spearman correlation
r = 0.60, p < 0.001
|
Stay updated, free dental videos. Join our Telegram channel

VIDEdental - Online dental courses


