Reference
Patients population
Confirmed breath odor problem
Quirynen et al. (2009)
N = 2,000 (1,078 F)
N = 1,687 (84.3%)
Age 2–90 year (39.2 ± 14.2)
Oral causes
N = 1,515 (89.8%)
Non oral causes
N = 97 (5.7%)
Tongue coating (TC)
N = 868 (51.4%)
Gingivitis (G)
N = 75 (4.4%)
Periodontitis (P)
N = 148 (8.7%)
Combination (TC/G/P)
N = 363 (21.5%)
Xerostomia
N = 50 (2.9%)
Dental
N = 7 (0.4%)
Candida
N = 4 (0.2%)
ENT tonsillitis
N = 14 (0.8%)
Rhinitis
N = 11(0.6%)
Sinusitis
N = 4(0.2%)
Nose obstruction
N = 8 (0.4%)
Extra oral:GI tract
N = 26 (1.5%)
TMAU
N = 1 (0.05%)
Systemic
N = 5 (0.2%)
Medication
N = 2 (0.1%)
Hormonal
N = 2 (0.1%)
Diet
N = 9 (0.5%)
Unknown
N = 15 (0.8%)
Oral-non oral combination
N = 75 (4.3%)
ENT + Oral:
N = 42 (2.4%)
GI + Oral:
N = 33 (1.9%)
Delanghe et al. (1996)
N = 260 (135 F)
N = 246 (94.6%)
Age 2–77 year (36 ± 13.5)
Oral causes
N = 225 (91.4%)
Non oral causes
N = 21 (8.5%)
Tongue coating
N = 92 (37.3%)
Gingivitis
N = 70 (28.4%)
Periodontitis
N = 63 (25.6%)
ENT:Chr. tonsillitis
N = 15 (6%)
Chr. sinusitis
N = 4 (1.6%)
Foreign bodies
N = 1 (0.4%)
Rhinitis
N = 1 (0.4%)
Seemann et al. (2006)
N = 407 (204 F)
N = 293 (72%)
Age 6–76 year (41.5 ± 13.8)
Oral causes
N = 272 (92.7%)
Non oral causes
N = 22 (7.3%)
Tongue coating (“physiologic”)
N = 175 (59.7%)
“Pathologic”
N = 97(33%)
Periodontitis
N = 80 (27.3%)
Gingival hyperplasia
N = 10 (3.4%)
Faulty restorations
N = 6 (2%)
ENT:Chr. tonsillitis
N = 15 (5.1%)
Chr. sinusitis
N = 2 (0.6%)
Foreign bodies
N = 2 (0.6%)
Systemic: diabetes
N = 2 (0.6%)
Smokers breath
N = 3 (1%)
The potential loci for malodor production within the oral cavity include the posterior portion of tongue’s dorsum, subgingival areas (e.g., periodontal pockets and interdental spaces), faulty restorations (e.g., leaking crowns and bridges), dental implants, dentures, and abscesses. Furthermore, transient oral dryness brought about by a temporal reduction in saliva flow plays an important part in promoting this condition.
Breath odors from the mouth are most commonly measured directly by human odor judges, or indirectly, based on the levels of volatile sulfide compounds (VSC) within the oral cavity (for further details, see Chap. 8).
Oral Malodor and the Tongue
The data presented in Table 2.1 clearly demonstrate that the tongue is by far the most common source for malodor production within the oral cavity. The posterior portion of the tongue’s dorsum, where most malodor originates, is often covered by a layer of debris comprising cellular (bacteria, desquamated epithelial cell, white blood cells) and noncellular components (especially proteins from saliva, postnasal, and gingival secretions). This layer termed “tongue coating” may vary in size, thickness, and color among individuals depending on oral activity (e.g., eating, drinking, smoking), oral hygiene, and oral health-related parameters (e.g., presence of periodontal disease); (Yaegaki and Sanada 1992a, b) (Fig. 2.1).
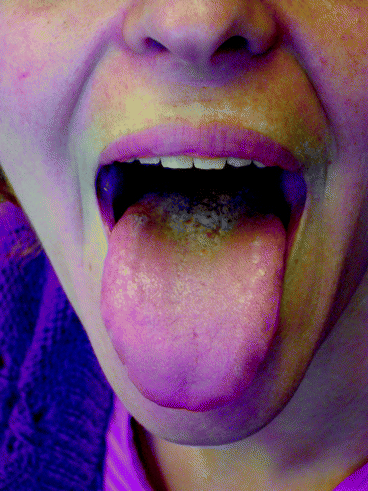
Fig. 2.1
Typical photo of a mild tongue coating covering the posterior third of the tongue dorsum
Over the last four decades, various measuring techniques have been suggested for tongue coating evaluation and quantification, taking into account various parameters such as coating thickness, coating area, and discoloration. Some of these methods are summarized in Table 2.2.
Table 2.2
Tongue coating measurements
|
Reference
|
Score
|
Description
|
|---|---|---|
|
Gross et al. (1975)
|
0
1
2
3
|
No coating
Slight coating
Moderate coating
Heavy coating
|
|
Yaegaki and Sanada (1992a)
|
Wet weight (mg)
|
Scraping off and weighing the tongue coating.
|
|
Miyazaki et al. (1995)
|
0
1
2
3
|
None visible
<1/3 tongue dorsum surface covered
<2/3 tongue dorsum surface covered
>2/3 tongue dorsum surface covered
|
|
Mantilla Gomez (2001)
|
Discoloration
|
|
|
0
1
2
3
4
|
Pink
White
Yellow/light brown
Brown
Black
|
|
|
Thickness
|
||
|
0
1
2
|
No coating
Light-thin coating
Heavy-thick coating
|
|
|
Oho et al. (2001)
|
Area
|
Area score × thickness score = tongue coating (range 0–6).
|
|
0
1
2
3
|
No tongue coating
<1/3 tongue dorsum surface covered
1⁄3–2⁄3 tongue dorsum surface covered
>2/3 tongue dorsum surface covered
|
|
|
Thickness
|
||
|
0
1
2
|
No tongue coating
Thin tongue coating (papillae visible)
Thick tongue coating (papillae invisible)
|
|
|
Winkel et al. (2003)
|
(Six areas grid)
|
Tongue dorsum is divided into six areas (i.e. three posterior and three anterior)
|
|
Coating
|
||
|
0
1
2
|
No coating
Light coating
Severe coating
|
|
|
Discoloration
|
||
|
0
1
2
|
No discoloration
Light discoloration
Severe discoloration
|
|
|
Score is calculated by adding all six scores (range 0–12)
|
||
|
Kim et al. (2009)
|
Tongue coating area
|
Calculated from digital images obtained by the digital tongue imaging system (DTIS)
|
Large epidemiological studies on the prevalence of oral malodor and its related parameters in the general population have been conducted in Japan (Miyazaki et al. 1995), China (Liu et al. 2006), and Switzerland (Bornstein et al. 2009). Significant associations have been reported comparing oral malodor with the level of tongue coating (Table 2.3). Furthermore, the level of malodor-related compounds (e.g., sulfide-containing compounds) produced on the posterior portion of the tongue dorsum were highly correlated with the overall mouth odor as measured by a human odor judge (r = 0.77, p < 0.01), as well as volatile sulfide levels (r = 0.63, p < 0.01) (Morita et al. 2001).
Table 2.3
Correlations among malodor related parameters
|
Reference
|
Malodor related parameters
|
Correlations
|
|---|---|---|
|
Miyazaki et al. (1995)
(n = 2,672)
|
Spearman correlation
|
|
|
Tongue coatinga vs. sulfide monitor
Periodontal conditionb vs. sulfide monitor
Plaque indexc vs. sulfide monitor
|
r = 0.44* − 0.57*
r = 0.34* − 0.58*
r = 0.13* − 0.31* (*p < 0.001)
|
|
|
Liu et al. (2006)
(n = 2,000)
|
Pearson correlation
|
|
|
Tongue coatinga vs. sulfide monitor Periodontal conditiond vs. sulfide monitor:
Calculus
Pocket depth
Bleeding index
Plaque indexc vs. sulfide monitor
|
r = 0.15* − 0.24*
r = 0.04NS − 0.21*
r = 0.02NS − 0.25*
r = 0.02NS − 0.30*
r = 0.08NS − 0.21*
|
|
|
Tongue coating1 vs. odor judge
Periodontal conditiond vs. odor judge
Calculus
Pocket depth
Bleeding index
Plaque indexc vs. odor judge
|
r = 0.20* − 0.31*
r = 0.20* − 0.29*
r = 0.17* − 0.31*
r = 0.12* − 0.22*
r = 0.15* − 0.26*
(NS-non significant,* p < 0.01)
|
|
|
Bornstein et al. (2009)
(n = 419)
|
Linear regression
|
|
|
Tongue coatinge vs. sulfide monitor
Tongue coatinge vs. odor judge
Periodontal conditiond vs. odor judge
|
4.29
2.35
2.45
|
Various studies comparing the tongue parameters of subjects with and without oral malodor showed that subjects with oral malodor had significantly greater tongue coating as compared with the no malodor controls (Haraszthy et al. 2007; Oho et al. 2001; Washio et al. 2005). Furthermore, mechanical removal of tongue coating results in a substantial decrease in oral malodor and its components (Yaegaki and Sanada 1992a). Research done by Tonzetich and Ng (Tonzetich and Ng 1976) showed that tongue brushing was very effective in reducing over 70% of the volatile sulfides as compared with about 30% reduction that resulted from tooth brushing.
Tongue coating samples can be obtained by scraping the posterior portion of the tongue’s dorsum using wooden spatula, plastic spoons, tooth brushes, swabs, or gauze pads (Grapp 1933). These samples very often release a putrid malodor very similar in character to oral malodor. Sampling the tongue coating using a plastic spoon (i.e., “spoon test”; (Rosenberg 1996) and scoring the malodor emanating from the spoon yielded highly significant associations with the oral malodor scores (i.e., odor judge) as well as other oral malodor-related parameters (Table 2.4).
Table 2.4
Correlations between tongue malodor scores and malodor related parameters
|
Reference
|
Malodor related parameters
|
Correlations
|
|---|---|---|
|
Kozlovsky et al. (1994)
(n = 52)
|
Pearson correlation
|
|
|
Tongue malodora vs. oral malodorb
Tongue malodor vs. sulfide monitorc
Tongue malodor vs. pocket depthd
Tongue malodor vs. GIe
Tongue malodor vs. PIf
|
r = 0.73, p < 0.001
r = 0.38, p = 0.003
r = 0.47, p = 0.005
r = 0.47, p < 0.001
r = 0.38, p = 0.003
|
|
|
Bosy et al. (1994)
(n = 127)
|
Pearson correlation
|
|
|
Tongue malodora vs. oral malodorb
Tongue malodor vs. sulfide monitorc
Tongue malodor vs. GIe
|
r = 0.55, p < 0.01
r = 0.40, p < 0.01
r = 0.23, p < 0.01
|
Stay updated, free dental videos. Join our Telegram channel
VIDEdental - Online dental courses


