Introduction
The purpose of this study was to investigate the mandibular posterior anatomic limit for molar distalization.
Methods
Three-dimensional computed tomography scans were obtained on 34 adults with a skeletal Class I normodivergent facial profile and a normal occlusion. Posterior available space was measured at the crown and root levels along the posterior occlusal line connecting the buccal cusps of the first and second molars on the axial slices. It was also measured at the occlusal level on the lateral cephalograms derived from the computed tomography scans. The measurements on the cephalograms were used to predict the actual posterior available space determined by computed tomography and to determine the presence of root contact with the inner lingual cortex by linear regression and discriminant analyses, respectively.
Results
The posterior available space was significantly smaller at the root level than at the crown level. Root contact was observed in 35.3% of the 68 roots. The posterior available space measured on the lateral cephalograms resulted in a regression equation with a coefficient of determination of 0.261 to predict actual available space and correctly identified root contact in 66.2% of cases with a threshold value of 3.9 mm.
Conclusions
The posterior anatomic limit appeared to be the lingual cortex of the mandibular body. Computed tomography scans are recommended for patients who require significant mandibular molar distalization.
Molar distalization is a nonextraction treatment modality used to correct Class II or Class III molar relationships and to relieve crowding without adverse arch expansion, which can jeopardize both esthetics and stability. Recently, its clinical significance has increased because of the introduction of temporary anchorage devices in orthodontic treatment; these enable predictable molar distalization with minimal patient compliance. Regardless of the anchorage unit used for distalization, however, there is a posterior anatomic limit beyond which orthodontic tooth movement can barely be achieved. Although the maxillary arch has a clear posterior limit—the maxillary tuberosity—the limit for the mandibular arch is not yet clear.
Previous studies regarding the retromolar region have focused on the posterior available space observed on panoramic radiographs or lateral cephalograms to calculate the posterior space discrepancy or to predict the prognosis of third molar eruption. In most of these studies, the anterior border of the ramus was presumed to be the posterior limit of the mandibular arch, and the available space was measured along the occlusal plane. However, these 2-dimensional radiographs have inherent sources of error, such as differential magnification and distortion, and also they are projected images that cannot represent the 3-dimensional (3D) morphology of the mandibular ramus.
Another issue that has received little attention to date is the limitation to the alveolar bone housing for posterior teeth caused by the inner and outer lingual cortexes of the mandibular body. With regard to alveolar bone housing, it has been suggested that teeth should be moved within the boundaries of cortical bones to form an “envelope of discrepancy,” which describes mainly incisor movement in the sagittal plane and molar movement in the coronal plane. However, little is known about the alveolar bone housing for the distalization of the mandibular molar, which might determine the posterior limit. This is possibly due to the lack of an appropriate diagnostic tool and the difficulty in anchorage preparation for mandibular molar distalization before the introduction of temporary anchorage devices to orthodontics. Recently, 3D computed tomography (CT) has become widely used in dental practice, and it can provide accurate anatomic information, such as cortical bone thickness and interroot distance.
The purposes of this study were to (1) determine the posterior anatomic limit by comparing the posterior available spaces measured at various levels of the mandibular second molar on axial slices of 3D CT, and (2) predict the posterior available space and the presence of root contact with the inner lingual cortex of the mandibular body using lateral cephalograms.
Material and methods
This study was performed using a subset of CT images of patients from a previous study, selected on the basis of the following criteria: (1) adult skeletal Class I patients with normodivergent facial profile (age, >18 years; ANB, >0° and <4°; sella-nasion to mandibular plane angle, >30° and <38°), (2) no notable facial asymmetry, (3) normal overjet and overbite with Class I molar relationships, (4) crowding less than 2 mm in both arches, (5) healthy periodontal state with no noticeable alveolar bone loss, (6) no prostheses or missing teeth except third molars, (7) intact roots with no root anomalies such as idiopathic root resorption and severe dilacerations, and (8) no history of orthodontic treatment. Thirty-four patients met the criteria and were included in this study. The characteristics of the patients are shown in Table I .
| Variable | Mean | SD | Minimum | Maximum |
|---|---|---|---|---|
| Age (y) | 22.0 | 3.7 | 18 | 29 |
| ANB (°) | 2.9 | 0.8 | 1.4 | 3.9 |
| SN-MP (°) | 34.7 | 2.3 | 30.2 | 37.8 |
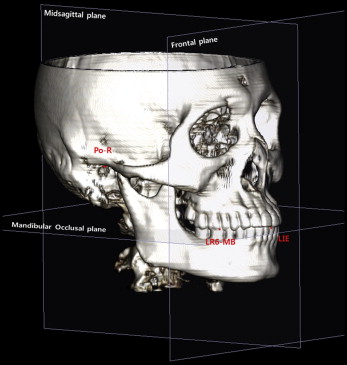
The 3D CT scans were obtained using Hispeed Advantage (GE Medical Systems, Milwaukee, Wis) with the following settings: 120 kV, 180 mA, slice thickness 3.0 mm, and pitch 1.5. The CT images were saved as DICOM files, each with a slice thickness of 1.0 mm. The DICOM data were reconstructed into 3D images using InVivoDental software (version 5.2; Anatomage, San Jose, Calif). The reconstructed 3D images were reoriented with the mandibular occlusal plane as a horizontal reference plane, connecting the midpoint of the mandibular incisor tip and both mesiobuccal cusps of the mandibular first molars to measure the posterior available space on the axial slices parallel to the mandibular occlusal plane. The coronal plane was constructed parallel to the transporionic line, while passing through the midpoint of the mandibular incisor tip, to generate CT-derived lateral cephalograms. The midsagittal plane was established at right angles to the horizontal and frontal planes, while passing through the midpoint of the mandibular incisor tip ( Fig 1 ).
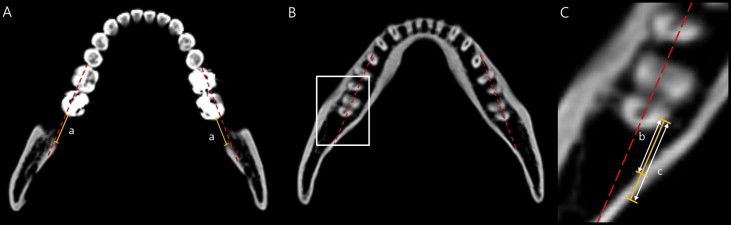
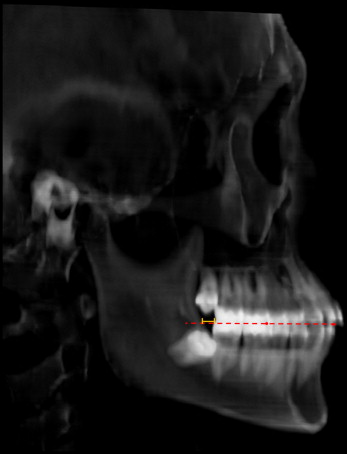
The linear distances described below were measured using the InVivoDental software program. Measurements at crown (CR) and root level (RL) were made on the axial slices of CT images. The shortest distance between the mandibular second molar crown and the outer cortex of the ramus was measured parallel to the posterior occlusal line (POL) connecting the buccal cusps of the mandibular first and second molars at the occlusal level (CR OL ), and 2 mm from the occlusal level (CR 2mm ) on the axial slices ( Fig 2 , A ). The shortest distances between the mandibular second molar root and the inner/outer lingual cortex of the mandibular body were then measured parallel to the POL, at depths of 2, 4, 6, 8, and 10 mm (RL in-2,4,6,8,10mm , RL out-2,4,6,8,10mm ) on the axial slices with the proximal cementoenamel junction as the reference level ( Fig 2 , B and C ). The number and percentage of the roots that were in contact with the inner lingual cortex of the mandibular body were calculated at each measurement level. Lastly, the distance between the mandibular second molar and the anterior border of the ramus was measured parallel to the mandibular occlusal plane at the occlusal level (Ceph OL ) on the CT-derived half-skull cephalograms generated with parallel projection, to eliminate the overlap of bilateral structures ( Fig 3 ).
Statistical analysis
All measurements were performed twice, by the same examiner (S.-J.K.), 2 weeks apart. The paired t test was conducted to verify the reproducibility of the measurements. The Dahlberg formula was used to calculate method errors: Se = √(d 2 /2n), where d is the difference between measurements, and n is the number of pairs of measurements. Since the paired t test showed no statistically significant difference between the measurements of the left and right sides, the averaged measurements were used.
To investigate the influence of the third molar on the posterior available space, the 34 patients were divided into 2 groups according to the presence of the mandibular third molar: a third-molar group (n = 23), in which both mandibular third molars were present, and a nonthird-molar group (n = 11), in which both third molars were extracted or congenitally missing. Since the 2-sample t test showed no significant differences between the 2 groups for any measurement, subsequent statistical analyses were performed on the whole sample, using SPSS for Windows (version 18.0; SPSS, Chicago, Ill). One-way analysis of variance (ANOVA) and Tukey post-hoc tests were performed to compare the measurements. The Pearson correlation analysis was used to investigate correlations between Ceph OL and CRs/RLs. Simple linear regression analysis was performed using RL in-10mm as the dependent variable and Ceph OL as the independent variable.
To perform a discriminant analysis with Ceph OL as a predictive variable, the 68 mandibular second molars of the 34 patients were divided into 2 groups: a contact group, in which the root was in contact with the lingual cortex on at least 1 level, and a noncontact group, in which the root was not in contact on any level. The 2-sample t test was performed to compare Ceph OL between these 2 groups. An unstandardized canonic discriminant function coefficient was calculated with a constant for Ceph OL , leading to an equation that assigns a score to each patient. The group centroid (mean score for each group) was calculated, after which the critical score (mean value of the 2 group centroids) was calculated. Since there was 1 predictive variable, the threshold value of Ceph OL was calculated. Last, the classification value of Ceph OL was tested.
Results
The paired t test showed no statistically significant difference between the measurements performed 2 weeks apart. The method errors ranged from 0.44 to 1.48 mm. When the posterior available space at the crown level as measured on the CT-derived lateral cephalograms was compared with that measured on the axial slices, Ceph OL was significantly smaller than CR OL and CR 2mm ( P <0.05), indicating that the lateral cephalograms understated the available space distal to the mandibular second molars ( Table II ).
| Between the crown and the anterior border of the ramus | Between the root and the outer lingual cortex of the mandible | P value | |||||||
|---|---|---|---|---|---|---|---|---|---|
| Ceph OL (n = 34) | CR OL (n = 34) | CR 2mm (n = 34) | RL out-2mm (n = 34) | RL out-4mm (n = 34) | RL out-6mm (n = 34) | RL out-8mm (n = 34) | RL out-10mm (n = 32) | ||
| Mean | 4.13 a | 11.43 b | 9.88 c | 9.07 d | 9.12 e | 8.57 f | 7.38 g | 6.71 h | <0.001 |
| SD | 1.83 | 2.94 | 2.91 | 2.98 | 3.13 | 3.14 | 3.07 | 2.89 | |
| Post-hoc Tukey test ( P <0.05) | |||||||||
| a <b,c,d,e,f,g,h | b >a,d,e,f,g,h | c >a,g,h | d <b d >a,h |
e <b e >a,h |
f <b f >a |
g <b,c g >a |
h <b,c,d,e h >a |
||
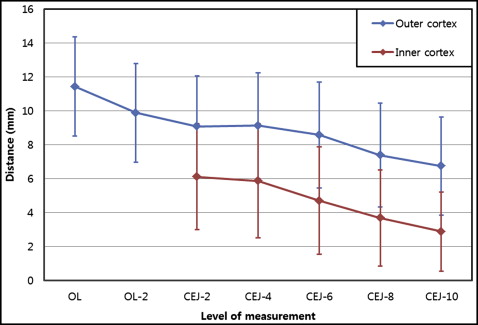
When comparing the distance to the outer cortex at the crown and root levels on the axial slice (CRs and RL out s), CR OL and CR 2mm were significantly larger than RL out-8mm and RL out-10mm ( P <0.05). This indicated that that the outer lingual cortex of the mandibular body, not the anterior border of the ramus, was the posterior anatomic limit when the molar was distalized along the POL. In addition, RL out-10mm was smaller than RL out-2mm and RL out-4mm , indicating that the available space decreased as the level of the measurements became closer to the root apex ( Table II , Fig 4 ). With regard to the distance to the inner cortex at root levels, RL in-2mm and RL in-4mm were also significantly smaller than RL in-8mm and RL in-10mm , indicating that similar to the outer lingual cortex, the space was smaller at the root apex ( Table III , Fig 4 ).
| RL in-2mm (n = 34) | RL in-4mm (n = 34) | RL in-6mm (n = 34) | RL in-8mm (n = 34) | RL in-10mm (n = 32) | P value | |
|---|---|---|---|---|---|---|
| Mean | 6.10 a | 5.87 b | 4.70 c | 3.67 d | 2.77 e | <0.001 |
| SD | 3.13 | 3.36 | 3.17 | 2.84 | 2.42 | |
| Post-hoc Tukey test ( P <0.05) | ||||||
| a >d,e | b >d,e | – | d <a,b | e <a,b | ||
In terms of the correlation between the distances measured on the CT-derived lateral cephalograms and those measured on the axial slices, Ceph OL exhibited moderate statistically significant correlations with CRs and RLs (r = 0.512-0.676) ( Table IV ). Since RL in-10mm was the smallest value among the RL in values, although it was not significantly different from RL in-6mm and RL in-8mm , and was considered to determine the clinical amount of molar distalization, simple linear regression analysis was performed to predict RL in-10mm with Ceph OL . This resulted in the following regression model, which was statistically significant ( P <0.01) ( Table V ).
| Correlation coefficient ( P value) | CR OL | CR 2mm | RL in-2mm | RL out-2mm | RL in-4mm | RL out-4mm | RL in-6mm | RL out-6mm | RL in-8mm | RL out-8mm | RL in-10mm | RL out-10mm |
|---|---|---|---|---|---|---|---|---|---|---|---|---|
| Ceph OL | 0.676 † | 0.639 † | 0.569 † | 0.556 ∗ | 0.589 † | 0.557 ∗ | 0.578 † | 0.570 † | 0.512 ∗ | 0.574 † | 0.534 ∗ | 0.633 † |
| <0.001 | <0.001 | <0.001 | 0.001 | <0.001 | 0.001 | <0.001 | <0.001 | 0.002 | <0.001 | 0.002 | <0.001 |
Stay updated, free dental videos. Join our Telegram channel
VIDEdental - Online dental courses


