Introduction
The purpose of this study was to investigate the relative growth rates (RGR) of the maxilla and the mandible according to quantitative cervical vertebral maturation (QCVM) of adolescents with normal occlusion.
Methods
Mixed longitudinal data were used. The sample included 87 adolescents (32 boys, 55 girls) from 8 to 18 years of age with normal occlusion, selected from 901 candidates. Sequential lateral cephalograms and hand-wrist films were taken once a year for 6 consecutive years. The growth magnitude (GM) and RGR of the maxilla and the mandible were measured and analyzed.
Results
GM and RGR were not always consistent, because subjects had different periods of time between the QCVM stages. GM was not as reliable as RGR. RGR had no significant sex differences in the maxilla and the mandible, in spite of different decelerating curves. However, statistically significant sex differences were found in the GM of mandibular measurements. The greatest growth potentials were not synchronized between the maxilla and the mandible. For both sexes, the greatest RGR of maxillary length and height was in QCVM stage I; then, deceleration occurred. The greatest RGR of mandibular length and height was in QCVM stage II, and the next largest was in QCVM stage I.
Conclusions
Understanding the RGR can provide references for orthodontic treatment and orthognathic surgery.
Adolescence is a period during which the rate of growth accelerates, reaching a peak velocity and then decelerating until adulthood. This pattern can be found in all people, but there are marked individual variations in the start, duration, rate, and amount of growth. Craniofacial growth prediction is an ultimate goal in craniofacial biology and is a major concern in orthodontics, because it is the key point in the diagnosis, prevention, interception, and treatment of malocclusions.
Hand-wrist radiographs have been used routinely in orthodontics to assess the peak of the growth spurt. However, there are concerns about extra radiation exposure. In addition, the British Orthodontic Society guidelines state that the use of hand-wrist radiographs to predict the onset of the pubertal growth spurt is not indicated. Because of this, cervical vertebral maturation (CVM) has been evaluated for its correlation to skeletal maturity as an alternative to the hand-wrist method. One obvious advantage of the CVM method is that a lateral cephalometric radiograph is routinely required for orthodontic diagnosis and treatment planning; no additional radiograph is required. But almost all previous evaluations of puberty with the cervical vertebrae on cephalometric radiographs either used or referred to the atlas of Lamparski. This was convenient because changes in cervical vertebral bodies can be evaluated with regard to growth in the atlas. However, an atlas cannot be used to evaluate growth in an objective and detailed manner because the results can differ from operator to operator.
Until now, cervical vertebrae were used only to determine the time of the pubertal growth peak or skeletal age, and no reports have predicted maxillofacial growth in a quantitative way. To evaluate the rate of maxillary and mandibular growth in various growth stages, a system of quantitative CVM (QCVM) proposed by Chen et al was used in this study. QCVM is a quantitative approach for identifying specific maturational stages over the entire adolescent growth period. Thus, the method used in this study was more objective than those used in most previous studies.
Yearly longitudinal data are of great value to orthodontists interested in the detailed study of facial growth. Previous studies investigating maxillary and mandibular growth were based on only cross-sectional data or focused on the growth magnitude (GM) of craniofacial structures. Generally, the growth rate has 2 expressions: absolute growth rate and relative growth rate (RGR). Absolute growth rate is often limited when comparing different objects, because the size of the object itself and the growth period significantly affect the comparability of results. In this study, RGR—the ratio of absolute growth per unit of time to the original quantity—was used as the potential indicator for biologic growth. Until now, no research of the RGR of craniofacial structures based on the CVM has been reported.
In orthodontics, the use of dentofacial orthopedic appliances is a main modality in the correction of jaw deformities. The effectiveness of these growth modifications depends on skeletal maturity, or, in other words, growth potential. But it is still not clear whether GM and RGR are always consistent. Sometimes, we take for granted that the growth period with the greatest GM has the greatest growth potential.
The purposes of this study, with a mixed longitudinal sample, were to examine the GM, the total increment of craniofacial structures; and to evaluate the RGR of craniofacial structures and compare it with the GM, to provide an accurate index of acceleration and deceleration of growth and to clarify the optimal timing for orthodontic treatment and orthognathic surgery.
Material and methods
Longitudinal population data were obtained from the Research Center of Craniofacial Growth and Development at Beijing University. More than 900 patients born in 1977 and 1978 were reviewed. The final study group included 87 adolescents (32 boys, 55 girls) from 8 to 18 years of age with normal occlusion. They were divided into 2 groups with different beginning ages of observation. In group 1 (43 subjects; 16 boys, 27 girls), the beginning age was 8 to 9 years; in group 2 (44 subjects; 16 boys, 28 girls), it was 12 to 13 years. Sequential lateral cephalograms and hand-wrist films were taken once a year for 6 consecutive years. Informed consent was obtained from all subjects and their parents. The study protocol was reviewed and approved by the institutional review board of Beijing University. The selection criteria were (1) deciduous, mixed, or permanent dentition; (2) normal occlusion (<3 mm overjet and overbite less than one-third coverage of the mandibular incisors); (3) harmonious facial profile and lip competence at rest; and (4) no orthodontic treatment before and during this study.
The sequential lateral cephalograms were divided into 11 maturation groups by a calibrated technician according to the Fishman skeletal maturity indicators (SMI) assessed from the hand-wrist films ( Table I ). Based on the SMI and the QCVM, SMI 1 to 3 were merged into QCVM I (period of accelerating velocity), SMI 4 to 7 were merged into QCVM II (period of high velocity), SMI 8 and 9 were merged into QCVM III (period of decelerating velocity), and SMI 10 and 11 were merged into QCVM IV (period of completion of velocity). Thus, the GM in SMI stages 1 to 3 represented that in QCVM stage I. Similarly, the GMs in SMI stages 4 to 7, 8 and 9, 10 and 11 represented those of QCVM stages II, III, IV, respectively.
| Average age (y) | Age range (y) | ||||
|---|---|---|---|---|---|
| SMI | n | Girls | Boys | Girls | Boys |
| 1 | 41 | 8.21 ± 1.07 | 9.21 ± 1.41 | 8.00-10.49 | 8.83-11.25 |
| 5 | 44 | 11.18 ± 1.19 | 12.28 ± 0.60 | 10.07-13.17 | 12.00-13.57 |
| 8 | 45 | 12.98 ± 0.61 | 14.19 ± 1.23 | 12.05-13.75 | 13.00-16.07 |
| 10 | 47 | 14.93 ± 0.90 | 16.22 ± 1.10 | 13.88-16.33 | 14.93-17.50 |
| 11 | 62 | 16.41 ± 1.39 | 17.60 ± 0.50 | 13.98-17.92 | 16.00-18.18 |
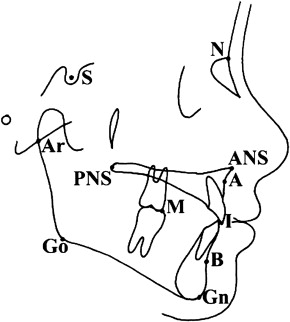
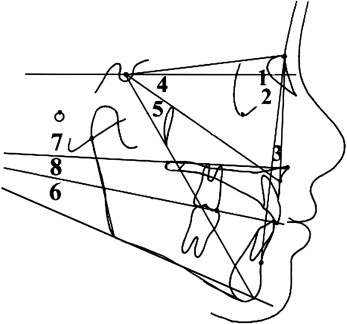
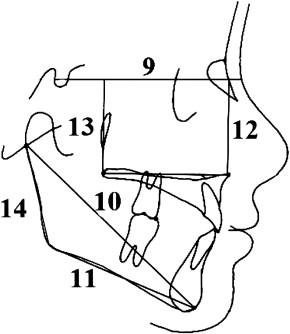
Fourteen cephalometric measurements ( Figs 1-3 ) indicating the longitudinal growth changes of the maxilla and mandible were measured exactly at SMI stages 1, 4, 8, 10, and 11. Measurements and GM were recorded, and the RGR was analyzed. RGR provided an accurate index of acceleration and deceleration of growth over a specific time ( Table II ). This required the measurement value (M) recorded at each record stage. The RGR formula was RGR = {(Mn – Mn-1)/t} × {100/Mn-1}. For example, RGR in QCVM I = {(SMI 4 – SMI 1)/t} × {100/SMI 1}.
| QCVM I (y) | QCVM II (y) | QCVM III (y) | QCVM IV (y) | |
|---|---|---|---|---|
| Boys | 1.80 ± 0.47 | 2.58 ± 0.81 | 2.03 ± 0.37 | 1.38 ± 0.32 |
| Girls | 1.70 ± 0.31 | 2.27 ± 0.41 | 1.95 ± 0.50 | 1.48 ± 0.26 |
All cephalometric radiographs were taken with the same x-ray machine. Cephalometric landmarks were identified by 1 observer (L.L.C.) under optimal conditions and then measured with micrometer calipers. When double projection gave rise to 2 points, or the right and left sides did not superimpose, the midpoint was used. Absolute values and GMs of linear and angular cephalometric measurements were recorded and analyzed. The measuring points and reference lines used, shown in Figures 1 through 3 , are defined in the corresponding legends to the figures.
Statistical analysis
The statistical analysis was performed with SPSS software for Windows (version 13.0, SPSS, Chicago, Ill). The arithmetic mean and standard deviation were calculated for each variable. Analysis of variance (ANOVA) and paired t tests were used. The level of significance was P = 0.05. Intraobserver reliability and reproducibility of the digitizer were checked on 20 randomly selected cephalometric radiographs that were retraced and redigitized 2 weeks later. The errors did not exceed 0.2 mm for the linear variables and 0.5° for the angular variables.
Results
As shown in Table III , SNA angle did not change significantly with QCVM for both sexes, but SNB angle increased and ANB angle decreased significantly, especially in the boys ( P <0.05). There were no significant sex differences in ANB and SNB angles during QCVM stage I. In QCVM stages II and III, the changes of ANB and SNB angles were greater for the boys than for the girls ( P <0.05).
| Measurement | Sex | QCVM I | QCVM II | QCVM III | QCVM IV | I-IV |
|---|---|---|---|---|---|---|
| SNA (°) | Male | 0.34 ± 0.10 | 0.33 ± 0.11 | 0.07 ± 0.03 | 0.02 ± 0.02 | 0.76 ± 0.09 |
| Female | 0.27 ± 0.09 | 0.40 ± 0.13 | 0.25 ± 0.09 | 0.05 ± 0.03 | 0.97 ± 0.11 | |
| SNB (°) | Male | 0.82 ± 0.15 | 2.02 ± 0.25 ∗ | 1.48 ± 0.21 ∗ | 0.20 ± 0.03 | 4.52 ± 0.32 ∗ |
| Female | 0.71 ± 0.14 | 1.41 ± 0.31 ∗ † | 0.72 ± 0.12 † | 0.07 ± 0.02 | 2.91 ± 0.28 ∗ † | |
| ANB (°) | Male | –0.48 ± 0.06 | –1.69 ± 0.28 ∗ | –1.41 ± 0.21 ∗ | –0.18 ± 0.02 | –3.76 ± 0.31 ∗ |
| Female | –0.38 ± 0.07 | –1.07 ± 0.20 ∗ † | –0.47 ± 0.10 † | –0.02 ± 0.02 | –1.94 ± 0.28 ∗ † | |
| SA/SN (°) | Male | 0.22 ± 0.06 | –0.24 ± 0.07 | 0.09 ± 0.04 | 0.19 ± 0.08 | 0.26 ± 0.05 |
| Female | 0.14 ± 0.04 | 0.08 ± 0.02 | 0.22 ± 0.09 | –0.12 ± 0.05 | 0.32 ± 0.05 | |
| SGn/SN (°) | Male | –0.35 ± 0.08 | –0.32 ± 0.06 | –0.23 ± 0.05 | –0.17 ± 0.03 | –1.07 ± 0.05 |
| Female | –0.28 ± 0.09 | –0.22 ± 0.05 | –0.38 ± 0.09 | –0.10 ± 0.04 | –0.98 ± 0.07 | |
| GoGn/SN (°) | Male | 1.15 ± 0.18 ∗ | 1.82 ± 0.28 ∗ | 1.14 ± 0.28 ∗ | 0.43 ± 0.11 | 4.54 ± 0.37 ∗ |
| Female | 1.19 ± 0.19 ∗ | 1.86 ± 0.23 ∗ | 1.15 ± 0.19 ∗ | 0.43 ± 0.10 | 4.63 ± 0.24 ∗ | |
| PNS-ANS/SN (°) | Male | 0.08 ± 0.08 | 0.18 ± 0.03 | 0.04 ± 0.02 | 0.03 ± 0.02 | 0.33 ± 0.07 |
| Female | 0.15 ± 0.11 | 0.11 ± 0.03 | 0.04 ± 0.04 | 0.08 ± 0.03 | 0.38 ± 0.07 | |
| OP/SN (°) | Male | –2.26 ± 0.83 ∗ | –2.34 ± 0.59 ∗ | –0.28 ± 0.10 | –0.19 ± 0.06 | –5.07 ± 0.52 ∗ |
| Female | –2.19 ± 0.49 ∗ | –2.20 ± 0.78 ∗ | –0.20 ± 0.07 | –0.22 ± 0.08 | –4.81 ± 0.42 ∗ | |
| ANS-PNS ┴ SN′ (mm) | Male | 2.51 ± 0.63 ∗ | 2.69 ± 0.43 ∗ | 1.48 ± 0.90 ∗ | 0.36 ± 0.12 | 7.04 ± 0.83 ∗ |
| Female | 2.33 ± 0.89 ∗ | 2.65 ± 0.84 ∗ | 0.62 ± 0.20 † | 0.22 ± 0.09 | 5.82 ± 0.69 ∗ † | |
| Ar-Gn (mm) | Male | 3.45 ± 0.83 ∗ | 7.61 ± 0.53 ∗ | 4.19 ± 0.87 ∗ | 2.32 ± 0.19 ∗ | 17.57 ± 0.99 ∗ |
| Female | 3.32 ± 0.79 ∗ | 6.43 ± 0.61 ∗ † | 2.21 ± 0.22 ∗ † | 1.66 ± 0.20 ∗ † | 13.62 ± 0.89 ∗ † | |
| Go-Gn (mm) | Male | 2.75 ± 0.58 ∗ | 5.41 ± 0.58 ∗ | 3.06 ± 0.39 ∗ | 2.11 ± 0.41 ∗ | 13.33 ± 0.88 ∗ |
| Female | 2.69 ± 0.49 ∗ | 4.95 ± 0.30 ∗ † | 2.34 ± 0.28 ∗ † | 1.12 ± 0.19 ∗ † | 11.10 ± 0.73 ∗ † | |
| ANS ┴ SN′ (mm) | Male | 3.46 ± 0.49 ∗ | 3.94 ± 0.23 ∗ | 1.02 ± 0.38 | 0.43 ± 0.20 | 8.85 ± 0.92 ∗ |
| Female | 3.19 ± 0.68 ∗ | 3.66 ± 0.59 ∗ | 0.89 ± 0.59 | 0.40 ± 0.16 | 8.14 ± 0.69 ∗ | |
| PNS ┴ SN′ (mm) | Male | 3.30 ± 0.58 ∗ | 3.76 ± 0.92 ∗ | 0.98 ± 0.48 | 0.41 ± 0.21 | 8.45 ± 0.83 ∗ |
| Female | 3.21 ± 0.51 ∗ | 3.68 ± 0.55 ∗ | 0.92 ± 0.72 | 0.40 ± 0.30 | 8.21 ± 0.41 ∗ | |
| Ar-Go (mm) | Male | 1.77 ± 0.87 ∗ | 4.66 ± 0.42 ∗ | 2.20 ± 0.51 ∗ | 0.45 ± 0.11 | 9.08 ± 0.94 ∗ |
| Female | 1.40 ± 0.62 ∗ | 3.99 ± 0.31 ∗ † | 1.38 ± 0.31 ∗ † | 0.40 ± 0.10 | 7.17 ± 0.73 ∗ † |
Stay updated, free dental videos. Join our Telegram channel
VIDEdental - Online dental courses


