Introduction
Our objective was to determine which factors were predictive of good long-term outcomes after fixed appliance treatment of Class II Division 1 malocclusion.
Methods
Two hundred seven patients with Class II Division 1 malocclusion were examined in early adulthood at a mean of 4.6 years after treatment with fixed appliances. The peer assessment rating index was used to evaluate dental alignment and occlusal relationships. The soft-tissue profile was assessed with the Holdaway angle.
Results
Logistic regression identified 3 pretreatment variables that were predictive of a good facial profile (Holdaway angle) at recall: the lower lip to E-plane distance ( P <0.001; smaller distance behind the E-plane means a better outcome), ANB angle ( P = 0.001; smaller ANB means a better outcome), and extraction pattern ( P = 0.026). Linear regression analysis showed that 2 pretreatment variables were predictive of a favorable PAR score at recall: SNB angle ( P = 0.001; larger SNB means a better outcome) and extraction pattern ( P = 0.034).
Conclusions
Three pretreatment cephalometric measures (lower lip to E-plane distance, ANB angle, and SNB angle) were predictive of the outcome in the treatment of Class II Division 1 malocclusion. The extraction pattern was also found to be a predictor of outcome.
Angle’s Class II Division 1 malocclusion represents a large proportion of the average orthodontist’s caseload. A study by Little showed that long-term changes in tooth alignment can occur, and Berg suggested that it is not appropriate to finally evaluate treatment results at the removal of the fixed appliances. A number of studies have evaluated treatment outcomes in Class II Division 1 malocclusions at varying times out of retention and found increases in overjet and overbite posttreatment. Several studies also examined the effect of overjet reduction on the facial profile.
Defining the quality of the outcome after orthodontic treatment is complex, and most previous studies of treatment outcomes in Class II Division 1 patients have evaluated data derived from study casts and cephalometric skeletal analyses. There is an emerging consensus among orthodontists for a more comprehensive approach when assessing orthodontic treatment outcomes that should embrace not only an assessment of dental alignment and occlusal and skeletal relationships but also an evaluation of the facial profile.
Therefore, in this study, we aimed to determine which, if any, pretreatment factors are useful in predicting the long-term outcomes of the occlusion and the soft-tissue profile among Class II Division 1 patients.
Material and methods
All patients in the study sample had received maxillary and mandibular fixed appliance treatment (0.022-in slot, Andrews’ prescription) in a community-based orthodontic department in Galway. Ethical approval was obtained from the local research ethics committee. The following inclusion criteria were applied.
- 1.
Pretreatment study models in good condition with an overjet of at least 6 mm.
- 2.
Posttreatment study models in good condition.
- 3.
All treated patients, including those who had finished treatment prematurely.
- 4.
Clinical records with a full documented history of each treatment episode, together with pretreatment and posttreatment lateral cephalometric radiographs.
Patients with syndromal conditions or marked hypodontia (more than 4 permanent teeth missing excluding the third molars) and those who had received functional appliance therapy were excluded. All patients who fulfilled the above criteria were contacted to attend for follow-up study casts and cephalometric records. The patients who did not attend were contacted twice by letter and a third time by telephone. The pretreatment, posttreatment, and recall study casts of all patients were scored by using the peer assessment rating (PAR). Cephalometric data were collected before and after treatment, and at recall. Cephalometric analysis included a soft-tissue analysis with the Holdaway angle. The Quick-Ceph Pro digitizing program 2000 (Orthodontic Processing, Coronado, Calif) was used. All cephalometric radiographs were taken on the same cephalostat. The cephalometric parameters, and treatment and demographic details collected are shown in Table I . Six distinct extraction patterns were identified in the sample: a nonextraction group, 4 different premolar extraction groups, and a group in which the extraction pattern included at least 1 first molar.
| ANB, SNB, and MMP angles |
| Maxillary incisor angle to maxillary plane |
| Mandibular incisor to A-pogonion line (mm) |
| Holdaway soft-tissue angle |
| Lower lip to E-plane (mm) |
| Overjet and overbite (mm) |
| Patient sex |
| Number of operators |
| Patient age |
| Duration of treatment |
| Whether treatment finished prematurely |
| Number of broken appointments |
| Number of cancelled appointments |
| Number of emergency appointments |
| Use of removable appliance to reduce overbite or distalize molars |
| Headgear duration |
| Use of transpalatal bar |
| Use of intermaxillary elastics |
| Extraction pattern |
| Number of archwires used |
| Duration of rectangular archwire use |
| PAR scores |
To assess reproduciblity, 30 cephalometric radiographs were redigitized, and 30 sets of study casts were rescored 1 week after the initial scoring.
Two variables were used to define a good outcome at recall: a measure of the soft-tissue profile (Holdaway angle) and a measure of alignment and occlusal relationships (PAR index).
The Holdaway angle was selected because it does not include the soft-tissue nasal tip, which shows considerable growth during the adolescent years. The categorization for the unadjusted Holdaway soft-tissue angle was based on the criteria of Holdaway, with the ideal range for the soft-tissue profile defined as 7° to 14°. The categorization for the PAR score was based on the criteria of Richmond et al, where a PAR score of zero represents perfect alignment and occlusal relationships, and higher scores indicate greater deviations from this ideal.
Statistical analysis
Initially, independent t tests and chi-square or Fisher exact tests were used to identify which of a series of patient, cephalometric, and treatment variables ( Table I ) were significantly associated with the Holdaway angle at recall. Subsequently logistic regression analysis was used to identify which independent variables were predictive of an ideal Holdaway angle at recall.
Initially, univariate analyses were used to identify variables that had no association with the PAR score at recall. After this, linear regression analysis (general linear model) was carried out, with the PAR score at recall as the dependent variable.
Results
A total of 398 patients had a Class II Division 1 malocclusion and matched the inclusion criteria for this study; 207 (52%) of them attended the recall (128 [62%] women and 79 [38%] men). There was a significant association between attendance for recall records and the distance that the patient lived from the orthodontic unit. With increased distance, fewer subjects attended (r = 0.56).
The mean ages were 14.9 years at the start of treatment and 16.7 years at the end of treatment. The patients were recalled a mean of 4.6 years (SD, 0.6) after debond at a mean age of 21.3 years. The mean retention period with removable Hawley retainers was 1.2 years (SD, 0.4).
The redigitization of 30 cephalograms showed no significant systematic errors and no method errors exceeding 1° or 1 mm.
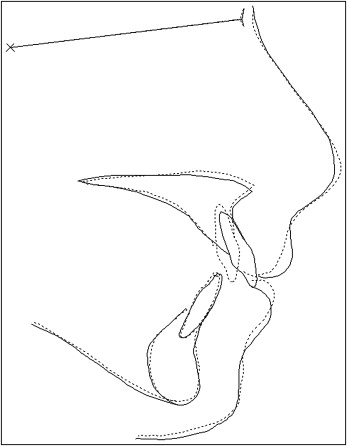
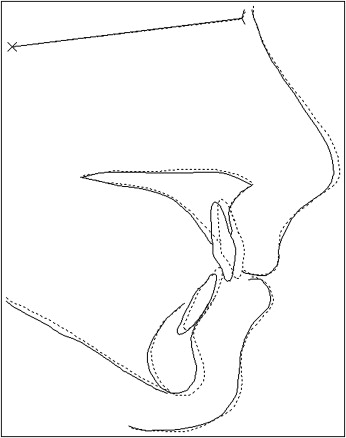
The mean values for the key cephalometric variables are highlighted in Table II . The mean pretreatment overjet for the sample was 10.3 mm, which reduced to a mean of 4.1 mm at debond and increased to a mean of 5.6 mm at recall. The mean pretreatment ANB angle was 5.4°; it reduced to a mean of 4.9° at debond and was similar at recall (4.8°). The mean unadjusted Holdaway soft-tissue angle reduced by 3.6° during treatment and by a further 1.2° during the posttreatment period ( Table II ). The mean cephalometric changes from pretreatment to posttreatment and posttreatment to recall are illustrated in Figures 1 and 2 .
| Pretreatment mean (SD) | End of treatment mean (SD) | Recall mean (SD) | |
|---|---|---|---|
| Overjet (mm) | 10.3 (2.4) | 4.1 (1.8) | 5.6 (2.0) |
| Overbite (mm) | 2.0 (2.7) | 1.1 (1.5) | 2.9 (2.1) |
| ANB (°) | 5.4 (2.5) | 4.9 (2.5) | 4.8 (2.6) |
| SNB (°) | 74.7 (3.2) | 74.5 (3.5) | 75.2 (3.7) |
| MMP (°) | 28.5 (6.6) | 27.6 (7.0) | 27.0 (7.3) |
| Holdaway (°) | 18.2 (4.1) | 14.6 (4.1) | 13.4 (3.9) |
In 7 recall subjects, it was not possible to record the Holdaway angle because of the unsatisfactory quality of the soft-tissue image. Among the 200 subjects for whom Holdaway data were available at recall, 10 subjects (5%) had an unadjusted Holdaway angle less than 7° (Class III profile), 112 (56%) had an ideal Holdaway soft-tissue angle (7°-14°), and 78 (39%) had a value greater than 14°, indicating a Class II profile. In the logistic regression analysis, the data were dichotomized into subjects with a Class II profile at recall (Holdaway angle, >14°) and subjects with an ideal profile (Holdaway angle, 7°-14°). The 10 subjects with a skeletal Class III profile at recall were excluded from this analysis.
For the PAR scores, no systematic error was found between the first and second readings with a paired t test ( P = 0.32). The mean difference was 1.06 PAR points, with the standard error of the difference equal to 4.16. The intraclass correlation coefficient was 0.89. The mean PAR score at the start of treatment was 35.5; it reduced to 6.3 at debond and then increased to 16.0 at recall ( Table III ).
| Pretreatment | End of treatment | Recall | |
|---|---|---|---|
| Mean | 35.5 | 6.3 | 16.0 |
| SD | 7.2 | 4.5 | 7.8 |
| Reduction | – | 82.2% | 54.8% |
| Minimum | 19.0 | 0.0 | 2.0 |
| Maximum | 68.0 | 24.0 | 42.0 |
Preliminary analysis of the pretreatment continuous variables by using independent t tests found that 6 pretreatment variables were significantly associated with the Holdaway angle at recall (overjet, lower lip to E-plane, mandibular incisor to A-pognion, and MMP, SNB, and ANB angles). Preliminary analysis of the categorical variables with the chi-square test also showed that the choice of extraction pattern was significantly associated with the Holdaway angle at recall. Logistic regression analysis was then completed by using these 7 independent variables. The following predictors of less good soft-tissue profile outcome (Holdaway angle, >14°) were identified ( Table IV ).
- 1.
Lower lip to E-plane distance ( P <0.001; a smaller distance behind the E-plane meant a better outcome).
- 2.
ANB angle ( P = 0.001; a smaller ANB angle meant a better outcome).
- 3.
Extraction pattern ( P = 0.026).
| Pretreatment values | Odds ratio | 95% CI | Wald | Significance |
|---|---|---|---|---|
| Lower lip to E-plane distance | 1.32 | 1.15-1.51 | 16.704 | <0.001 |
| ANB angle | 1.35 | 1.13-1.60 | 11.649 | 0.001 |
| Extraction pattern | 12.761 | 0.03 | ||
| ∗ Nonextraction | 1.00 | |||
| Extraction 4|4 | 0.29 | 0.09-0.93 | 4.355 | 0.04 |
| Extraction 4|4 4|4 | 1.33 | 0.44-4.01 | 0.265 | 0.61 |
| Extraction 4|4 5|5 | 0.25 | 0.07-0.83 | 5.105 | 0.02 |
| Extraction 5|5 5|5 | 0.55 | 0.16-1.93 | 0.868 | 0.35 |
| Extraction pattern including 1st molars | 0.97 | 0.33-2.82 | 0.003 | 0.95 |
Table IV also shows a hierarchy of extraction patterns, with patients who had extraction of both maxillary first premolars or both maxillary first premolars and both mandibular second premolars more likely to have ideal soft-tissue profiles (Holdaway angle, 7°-14°). In this comparison of extraction patterns, the nonextraction group served as a baseline against which the other extraction groups were compared. The receiver operating characteristic statistic of 80% indicated that the model performed well in identifying patients with a good soft-tissue profile.
Table V reports the mean Holdaway values before treatment and at recall. Analysis of variance (ANOVA) showed that the differences among the pretreatment Holdaway values for the different extraction patterns just reached significance ( P = 0.047). The 4 second premolar extraction group and the nonextraction group had lower mean pretreatment Holdaway angles.
| Extraction pattern | Patients (n) | Mean Holdaway at pretreatment | Mean Holdaway at recall | Mean PAR score at pretreatment | Mean PAR score at recall |
|---|---|---|---|---|---|
| Nonextraction | 36 | 17.33 | 13.06 | 32.92 | 14.18 |
| Extraction 4|4 | 34 | 17.86 | 12.57 | 35.47 | 15.18 |
| Extraction 4|4 4|4 | 35 | 19.73 | 15.38 | 36.05 | 17.32 |
| Extraction 4|4 5|5 | 29 | 18.37 | 12.28 | 34.84 | 13.90 |
| Extraction 5|5 5|5 | 22 | 16.59 | 11.93 | 33.78 | 13.50 |
| Extraction pattern including first molars | 34 | 18.35 | 13.30 | 37.68 | 19.58 |
Stay updated, free dental videos. Join our Telegram channel
VIDEdental - Online dental courses


