Introduction
This study was performed to estimate the effects of risedronate on mandibular bone density, bone structure, and bone metabolism in established glucocorticoid-induced osteoporosis in growing rats.
Methods
The rats were given oral risedronate at 0, 0.5, or 1.0 mg per kilogram per day for 4 weeks afterthe administration of oral prednisolone at 30 mg per kilogram per 2 days for 6 weeks. Trabecular and cortical bone masses were analyzed by using peripheral quantitative computed tomography, and bone structure and bone formation were measured by using static and dynamic histomorphometry.
Results
In trabecular bone, risedronate improved the prednisolone-induced decreases in bone cross-sectional area and bone mineral content. Risedronate increased bone density and also formed dense bone microarchitecture by reducing the bone turnover rate. In cortical bone, risedronate improved the prednisolone-induced decreases in bone cross-sectional area and bone mineral content without affecting bone density by increasing the mineralizing surface.
Conclusions
Risedronate improved prednisolone-induced retardation of trabecular and cortical bone growth, but the bone turnover in these 2 sites was regulated differently in the growing rat mandibles.
Glucocorticoids are used to treat various diseases, such as severe asthma, juvenile rheumatoid arthritis, and chronic renal diseases, but the incidence rate of glucocorticoid-induced osteoporosis is approximately 50% in patients treated for 6 months or longer. In children, not only osteoporosis but also growth retardation occurred with chronic glucocorticoid therapy. Bone mass increases dramatically during childhood and adolescence, peaking in young adulthood (the peak bone mass ) plateaus, and finally declines. The bone that must last a lifetime is made between the ages of 10 and 18 years. Patients whose bone mass does not reach the peak during childhood because of glucocorticoid-induced osteoporosis are at permanent risk of suffering fractures. In oral bone tissues, glucocorticoid affects mandibular bone growth and bone strength in humans and animals. However, little is known about bone metabolism and bone microarchitecture of the mandible with glucocorticoid-induced osteoporosis in children and adolescents. Furthermore, no guidelines exist for treating glucocorticoid-induced osteoporosis in children.
Bisphosphonates, which are widely used to manage adults with osteoporosis as first-line therapeutic agents, are divided into 2 classes according to their chemical structure and mechanism of action. The nitrogen-containing bisphosphonates, such as alendronate and risedronate, are markedly more potent inhibitors of osteoclastic bone resorption than nonnitrogen-containing bisphosphonates, such as etidronate and clodronate. Several recent reports described cases of osteonecrosis of the mandible associated with nitrogen-containing bisphosphonate therapy, and controversy is ongoing regarding this issue. A few clinical studies have indicated that bisphosphonate therapy inhibited loss of long bones in children with osteogenesis imperfecta and glucocorticoid-induced osteoporosis. However, the effects of nitrogen-containing bisphosphonates on bone structure and bone formation of the mandible in cases of established glucocorticoid-induced osteoporosis during the growth phase are unknown, and the cause of bisphosphonate-induced osteonecrosis of the jaw has not been clarified.
Peripheral quantitative computed tomography (pQCT) can be used to measure cortical and trabecular parts separately; this is useful for analyzing bone masses and cross-sectional areas, and also provides volumetric data. Recently, microcomputed tomography has been applied to quantify trabecular bone structure, such as trabecular bone volume and trabecular thickness. However, in the analyses withy pQCT and microcomputed tomography, we can evaluate static phenomena of bone metabolism but not those associated with bone formation because the data have a temporal component. Both static and dynamic histomorphometry can be performed with 2-dimensional evaluation by using prepared specimens.
In this study, we evaluated the effects of risedronate, used frequently for treating osteoporosis, on trabecular and cortical bone density with pQCT, and bone structure and bone metabolism with static and dynamic histomorphometry in the mandibles of growing glucocorticoid-treated rats.
Material and methods
In total, 48 male Wistar rats, aged 5 weeks, were purchased from Charles River Japan (Kanagawa, Japan). The animals were housed individually and maintained under a 12-hour light and 12-hour dark cycle at a constant temperature of 22°C ± 1°C with humidity of 50% ± 5%. The animals were given a standard pelleted chow containing 1.14% calcium and 1.06% phosphorus (CE-2, CLEA Japan, Tokyo, Japan). The animal procedures were all approved by the Committee for the Care and Use of Laboratory Animals of Kyushu Dental College.
The animals were divided randomly into 6 groups of 8 each as follows: (1) control 6 weeks; (2) prednisolone (pred) 6 weeks; (3) control 10 weeks; (4) pred + saline solution; (5) pred + low risedronate (ris); and (6) pred + high ris ( Table I ). In the pred + saline and pred + ris groups, prednisolone was administered for 6 weeks followed by vehicle or ris for 4 weeks. Prednisolone sodium succinate (Prednine, Shionogi & Co, Osaka, Japan) was administered orally at 30 mg per kilogram per day on alternate days. Risedronate sodium (Ajinomoto, Tokyo, Japan) was administered orally at 0.5 mg per kilogram per day or 1.0 mg per kilogram per starting immediately after the 6-week prednisolone regimen. We compared the control 6 weeks group with the pred 6 weeks group to confirm the establishment of osteoporosis induced by prednisolone administration. The effects of risedronate treatment were evaluated in the remaining 4 groups. The doses and durations of prednisolone treatment were determined from the results of a previous study that confirmed mandibular bone deterioration. The doses and durations of risedronate were determined from a previous study that demonstrated significant inhibition of bone loss in immobilized rats. Both compounds were dissolved in sterile saline solution before delivery so that the required dose was in a volume of 10 mL per kilogram of body weight. Prednisolone and vehicle (saline solution) were administered in the morning. Risedronate and vehicle (saline solution) were administered in the afternoon in animals that had fasted for 4 hours previously and 2 hours after risedronate administration. All rats were given free access to water throughout the experimental period.
| Treatment group | Experimental period | |
|---|---|---|
| 6 weeks | 4 weeks | |
| Control 6 weeks | Prednisolone vehicle (saline) | — |
| Pred 6 weeks | Prednisolone 30 mg/kg/2 days | — |
| Control 10 weeks | Prednisolone vehicle (saline) | Risedronate vehicle (saline) |
| Pred + saline solution | Prednisolone 30 mg/kg/2 days | Risedronate vehicle (saline) |
| Pred + low ris | Prednisolone 30 mg/kg/2 days | Risedronate 0.5 mg/kg/day |
| Pred + high ris | Prednisolone 30 mg/kg/2 days | Risedronate 1.0 mg/kg/day |
Body weight was measured weekly. At the end of the experimental period, all rats were deeply anesthetized with diethyl ether and given a lethal injection of thiamylal natrium (Isozole; Mitsubishi Pharma, Osaka, Japan) intraperitoneally at a dose of 90 mg per kilogram of body weight.
For dynamic histomorphometry, all rats were given a subcutaneous injection of calcein (8 mg/kg of body weight; Kanto Chemical, Tokyo, Japan) on days 10 and 3 before they were killed. Bilateral hemi-mandibles were removed from each animal, trimmed of soft tissues, and stored in 70% ethanol. The left hemi-mandible was used for measurement of mandibular bone weight as an index of bone growth and for pQCT analysis. The right hemi-mandible was used for histopathologic evaluation and bone histomorphometry.
Bone density (BD; mg/cm 3 ), cross-sectional area (CSA; mm 2 ), and mineral content (MC; mg/mm) of trabecular (Tr) and cortical (Ct) bone from the left hemi-mandible were measured by using pQCT (XCT Research SA+ series; Stratec, Medizintechnik, Pforzheim, Germany). For measurement of TrBD, TrCSA, TrBMC, CtBD, CtCSA, and CtBMC, we scanned between the center of the mesial root of the mandibular first molar that contained rich trabecular and cortical bone at 3 positions with an interval of 0.1 mm and measured the cortical component using a voxel size of 0.08 × 0.26 mm. The trabecular region was defined manually, and the cortical region was defined by setting a threshold value of 690 mg per cubic centimeter.
The measurement errors for TrBD, CtBD, TrCSA, and CtCSA were calculated according to the formula of Dahlberg : Se = √∑d 2 /2n, where ∑d 2 is the sum of the squared differences between pairs of recordings and n is the number of duplicate measurements. The errors were 2.1 mg per cubic centimeter, 1.3 mg per cubic centimeter, 0.17 mm 2 , and 0.05 mm 2 , respectively.
The trimmed right hemi-mandibles were fixed in 70% ethanol and stained with Villanueva bone stain. The bone tissues were then dehydrated in ethanol and embedded in methylmethacrylate. Frontal cross-sections of the mesial root of the mandibular first molar region were cut (300 μm) and polished (20 μm) with a precision bone saw (cutting grinding system, EXAKT Apparatebau, Norderstedt, Germany). The Villanueva-stained specimens were used to assess dynamic histomorphometry. After static and dynamic histomorphometric measurements, each specimen was also stained by using the Goldner method for histopathologic evaluation.
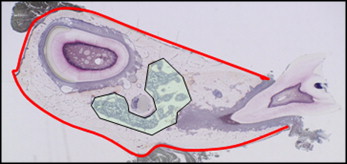
Images of the mandibular bone were scanned under a light epifluorescence microscope (Carl Zeiss, Thornwood, NY). Histomorphometric parameters were measured at 200-times magnification by using a semiautomatic method (Osteoplan II, Kontron, Munich, Germany). Measurement areas are shown in Figure 1 . The measured parameters for trabecular bone included total bone tissue (TV), bone volume (BV), bone surface (BS), eroded surface (ES), single-labeled surface (sLS), double-labeled surface (dLS), and the width between double fluorochrome labels (Ir.L.Th). The static histomorphometric parameters were as follows: percentage of trabecular bone volume (BV/TV; %), trabecular number (Tb.N, 1/mm), trabecular thickness (Tb.Th, μm), trabecular separation (Tb.Sp, μm), and eroded surface (ES/BS, %). The dynamic histomorphometric parameters were as follows: mineralizing surface (MS/BS = [dLS+sLS/2]/BS, %), mineral apposition rate (MAR = Ir.L.Th/7 days; μm/day), and bone formation rate (BFR/BS = MAR×MS/BS×0.365; mm 3 /cm 2 per year). The measured parameters for cortical bone were induced periosteal bone surface (perimeter) and the lengths of the sLS and dLS. These data were used to calculate MS/BS, MAR, and BFR/BS. The terminology used is in accordance with the American Society for Bone and Mineral Research Committee on Histomorphometric Nomenclature.
Statistical analysis
Data are presented as means and standard deviations, and statistical comparisons between the control 6 weeks and the pred 6 weeks groups were performed by using 2-tailed t tests for unpaired samples. Multiple comparisons among the 4 10-week treatment groups were performed by 1-way analysis of variance (ANOVA) with the Tukey method. The level of significance was set at 5%.
Results
The body weight and mandibular bone weight in the pred 6 weeks group were significantly lower than those in the control 6 weeks group, and these differences persisted after 4 weeks of treatment with saline solution. However, treatment with risedronate reversed the prednisolone-induced decrease in mandibular bone weight ( Table II ).
| Control 6 weeks | Pred 6 weeks | Control 10 weeks | Pred + vehicle | Pred + ris (0.5 mg/kg) |
Pred + Ris (1.0 mg/kg) |
|
|---|---|---|---|---|---|---|
| Initial body weight (g) | 135.18 ± 2.89 | 133.48 ± 2.44 | 135.88 ± 1.31 | 136.38 ± 2.55 | 135.83 ± 1.92 | 134.75 ± 1.76 |
| Final body weight (g) | 407.65 ± 11.41 | 368.63 ± 12.09 ∗ | 422.80 ± 11.20 | 378.63 ± 12.46 † | 384.7 ± 17.35 † | 386.43 ± 20.57 † |
| Mandibular bone weight (g) | 0.43 ± 0.02 | 0.40 ± 0.02 ∗ | 0.52 ± 0.02 | 0.49 ± 0.03 † | 0.51 ± 0.02 | 0.50 ± 0.03 |
The values of TrCSA, TrBMC, CtCSA, and CtBMC in the pred 6 weeks group were significantly lower than those in the control 6 weeks group, and these decreases did not improve after 4 weeks of saline-solution treatment. Although the mean value of CtBD in the pred 6 weeks group was lower than that in the control 6 weeks group, the difference was not significant. TrBD in the pred 6 weeks group was significantly higher than that in the control 6 weeks group. TrBD increased with risedronate in a dose-dependent manner, but lower doses of risedronate showed a tendency to improve TrCSA and TrBMC, and higher doses of risedronate significantly reduced these parameters compared with the control 10 weeks group ( Table III ).
| Control 6 weeks | Pred 6 weeks | Control 10 weeks | Pred + saline | Pred + low ris | Pred + high ris | |
|---|---|---|---|---|---|---|
| Trabecular bone density (mg/cm 3 ) | 608.51 ± 38.91 | 646.38 ± 35.28 ∗ | 707.60 ± 16.47 | 685.13 ± 28.79 | 684.73 ± 29.32 | 723.97 ± 26.00 ‡,§ |
| Trabecular bone cross-sectional area (mm 2 ) | 1.56 ± 0.42 | 1.15 ± 0.24 ∗ | 1.70 ± 0.38 | 1.22 ± 0.25 † | 1.35 ± 0.47 | 1.19 ± 0.23 † |
| Trabecular bone mineral content (mg/mm) | 1.01 ± 0.27 | 0.78 ± 0.20 ∗ | 1.20 ± 0.26 | 0.83 ± 0.16 † | 0.92 ± 0.30 | 0.86 ± 0.17 † |
| Cortical bone density (mg/cm 3 ) | 1268.86 ± 9.48 | 1261.75 ± 11.21 | 1301.63 ± 14.65 | 1296.55 ± 9.15 | 1301.45 ± 8.32 | 1298.41 ± 9.22 |
| Cortical bone cross-sectional area (mm 2 ) | 6.73 ± 0.67 | 6.08 ± 0.63 ∗ | 7.40 ± 0.52 | 6.74 ± 0.32 † | 7.33 ± 0.33 ‡ | 7.51 ± 0.57 ‡ |
| Cortical bone mineral content (mg/mm) | 8.54 ± 0.87 | 7.67 ± 0.80 ∗ | 9.62 ± 0.64 | 8.74 ± 0.36 † | 9.55 ± 0.41 ‡ | 9.75 ± 0.72 ‡ |
∗ P <0.05 vs control 6 weeks group ( t test)
† P <0.05 vs control 10 weeks group (ANOVA and Tukey test)
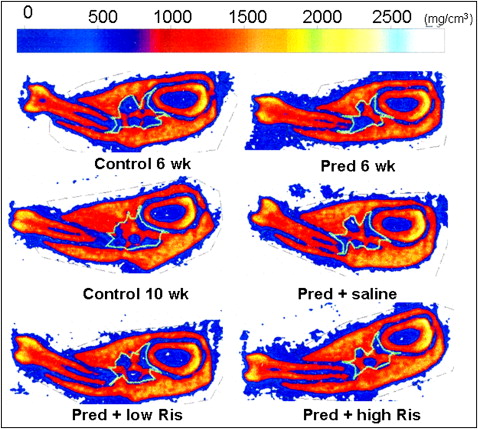
In cortical bone, both doses of risedronate improved the prednisolone-induced decreases in CtCSA and CtBMC ( Table IV ). Another representative pQCT mandibular bone scan indicated that the trabecular region in the pred 6 weeks group clearly decreased compared with the control 6 weeks group, and risedronate treatment dose-dependently reduced the trabecular bone area and increased the mineralization of trabecular bone ( Fig 2 ).
| Control 6 weeks | Pred 6 weeks | Control 10 weeks | Pred + saline | Pred + low ris | Pred + high ris | |
|---|---|---|---|---|---|---|
| BV/TV (%) | 73.03 ± 7.48 | 68.90 ± 3.25 | 67.37 ± 0.33 | 68.09 ± 1.92 | 69.89 ± 1.27 | 70.93 ± 2.09 |
| Tb.Th (μm) | 367.32 ± 25.22 | 398.75 ± 18.84 | 350.68 ± 48.98 | 347.53 ± 46.89 | 364.51 ± 19.26 | 345.54 ± 30.62 |
| Tb.N (1/mm) | 1.90 ± 0.18 | 1.64 ± 0.17 | 1.99 ± 0.23 | 1.80 ± 0.22 | 1.92 ± 0.07 | 2.36 ± 0.32 ‡ |
| Tb.Sp (μm) | 149.66 ± 11.90 | 190.89 ± 19.47 ∗ | 177.87 ± 25.72 | 184.03 ± 20.00 | 156.80 ± 4.47 | 123.33 ± 15.82 †,‡ |
∗ P <0.05 vs control 6 weeks group ( t test)
The results of trabecular microstructural parameters indicated a significantly higher Tb.Sp in the pred 6 weeks group relative to the control 6 weeks group, and risedronate treatment dose-dependently reduced Tb.Sp and increased Tb.N ( Table V ).
| Control 6 weeks | Pred 6 weeks | Control 10 weeks | Pred + saline | Pred + low ris | Pred + high ris | |
|---|---|---|---|---|---|---|
| Ob.S/BS (%) | 6.00 ± 3.62 | 12.66 ± 3.62 ∗ | 3.19 ± 1.47 | 1.20 ± 0.30 | 0.71 ± 0.65 † | 1.06 ± 0.38 † |
| MAR (μm/day) | 1.69 ± 0.14 | 1.33 ± 0.20 | 1.23 ± 0.07 | 1.17 ± 0.17 | 1.30 ± 0.58 | 0.94 ± 0.03 |
| MS/BS (%) | 19.25 ± 8.86 | 25.67 ± 4.07 | 5.72 ± 0.32 | 3.97 ± 2.00 | 1.92 ± 0.68 † | 3.94 ± 0.20 |
| BFR/BS (mm 3 /cm 2 /y) | 14.78 ± 4.73 | 12.31 ± 0.82 | 2.56 ± 0.23 | 1.63 ± 0.63 | 0.94 ± 0.51 † | 1.36 ± 0.11 † |
| Oc.S/BS (%) | 0.21 ± 0.18 | 1.49 ± 0.51 ∗ | 0.72 ± 0.09 | 0.65 ± 0.29 | 0.56 ± 0.09 | 0.35 ± 0.10 |
| ES/BS (%) | 1.56 ± 0.32 | 5.12 ± 1.39 ∗ | 2.46 ± 0.50 | 3.21 ± 0.32 | 2.01 ± 0.46 ‡ | 1.09 ± 0.17 †,‡ |
∗ P <0.05 vs control 6 weeks group ( t test)
Stay updated, free dental videos. Join our Telegram channel
VIDEdental - Online dental courses


