Introduction
The purpose of this study was to establish the causal relationships between expansion force magnitudes, sutural separation, and sutural bone formation.
Methods
Thirty-seven 6-week-old rabbits were randomly assigned to 4 force groups (0, 50, 100, or 200 g). Constant forces were delivered for 42 days by nickel-titanium open-coil springs to miniscrew implants (MSIs) placed in the frontal bone on both sides of the midsagittal suture. Inter-MSI and bone marker widths were measured biweekly to quantify sutural separation and MSI movements. Sutural bone formation was quantified based on the incorporation of fluorescent bone labels administered at days 18, 28, and 38.
Results
Nine of 74 MSIs failed between days 0 and 14, including 4 in the controls and 5 in the 50-g group. A decelerating curvilinear pattern of sutural separation was evident in the 50-g, 100-g, 200-g groups. Bone markers showed that sutural widths increased by 0.6, 3.2, 5.1, and 6.2 mm in the control, 50-g, 100-g, and 200-g groups, respectively. Except for the 200-g group, significantly greater amounts of bone formation were observed between days 18 and 28 than between days 28 and 38. Sutural bone formation also increased with increasing forces up to 100 g; there was no difference between the 100-g and the 200-g groups. Sutural separation explained 71% and 53% of the variations in bone formation between days 18 and 28 and days 28 and 38, respectively.
Conclusions
Within the limits of this study, sutural bone formation is directly related to the amount of sutural separation, which is in turn related to the amount of force applied. The results suggest that there is a level of induced sutural separation that provides the greatest amount of bone formation.
It has been well established that sutural expansion stimulates bone formation. Once expansion forces are applied, tissue trauma occurs with disruption of collagen fibers and blood vessels, together with cell death of fibroblasts. However, most of the collagen fibers and the periosteum remains intact, and the osteoblast layers close to the bone margins survive to form successive lamellae within 3 to 4 days. As the suture separates, new bone forms along the collagen fibers aligned perpendicularly across the suture.
Although higher forces have been related to greater sutural separation, the exact nature of the relationship remains unclear. Histologic and biometric studies have shown that short-term sutural separation relates to the magnitude of the expansion forces. Morndal, who expanded rats’ interpremaxillary sutures for 27 hours, confirmed that the amount of sutural separation was linearly related to the magnitude of force. Over a longer time period (28 days), Yen et al showed that the springs activated 2 mm with heavier forces produced faster rates of expansion than those activated 2 mm with lighter forces, even though both ultimately produced similar amounts of sutural separation. Importantly, all experimental studies used helical springs. Because the forces of these springs decay as the suture expands, it is difficult to quantify the exact nature of the relationships between forces and sutural separation.
The relationship between sutural bone formation and the amount of expansion force remains poorly understood. The increases in alkaline phosphatase-stained cells associated with heavy force levels indicate increased bone formation. It has also been shown that DNA synthesis of fibroblasts and osteoblasts increases with increasing forces, and eventually plateaus at higher force levels. DNA synthesis of fibroblasts and osteoblasts has also been shown to decrease at higher forces, possibly due to tissue damage. In the only study that directly evaluated the relationships between bone formation and sutural expansion, Parr et al reported no significant difference in bone formation rates between 1-N and 3-N expansion forces. However, their mineral apposition rates suggested a possible difference; because of small sample sizes, the study’s power might have been insufficient to detect the differences. Whether there is an optimal force level to produce the greatest sutural bone formation remains questionable. Our goal was to better understand how sutures respond to varying amounts of force application. Histomorphometric and biometric analyses were performed to test the hypotheses that (1) sutural separation increases as a function of increasing expansion forces, (2) bone formation increases as a function of expansion force magnitude, and (3) bone formation is related to sutural separation. Our clinical objective was to determine whether there is an optimal force that maximizes sutural bone formation. If there is such a force, it provides a potential means of making expansion therapies more effective and efficient.
Material and methods
The sample included 37 six-week-old male New Zealand white rabbits. The housing, care, and experimental protocol were in accordance with the guidelines of the Institutional Animal Care and Use Committee of Baylor College of Dentistry. The rabbits were randomly assigned to 4 groups: 50-g force (n = 11), 100-g force (n = 9), 200-g force (n = 9), or 0-g force (control) (n = 8). The expansion forces were delivered for 42 days; no forces were used in the control group.
All animals were anesthetized with ketamine at 75 mg per kilogram intramuscularly and 0.5% acepromazine at 5 mg per kilogram intramuscularly (Marcaine, Abbott Laboratories, Abbott Park, Ill), with 1:200,000 epinephrine serving as the local anesthetic. All surgical procedures were performed under sterile conditions. After reflecting the skin and the periosteum midway between the anterior and posterior limits of the orbital rims, the midsagittal suture and the frontal bone were exposed ( Fig 1 , A ). Pilot holes were drilled with a size-2 round burr with a low-speed hand piece (<600 rpm) and copious saline-solution irrigation. Two custom-made Dentos (Daegu, Korea) miniscrew implants (MSIs; 3.0 mm long × 1.7 mm in diameter) were placed approximately 4 mm on either side of the midsagittal suture with a manual driver ( Fig 2 ).
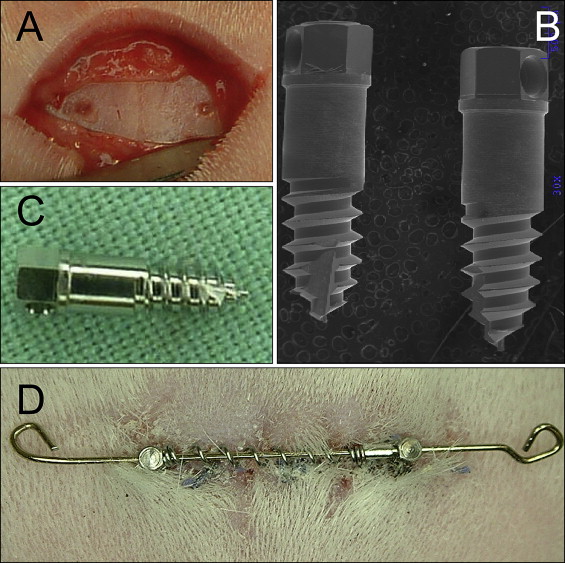
 MSI;
MSI;  bone marker.
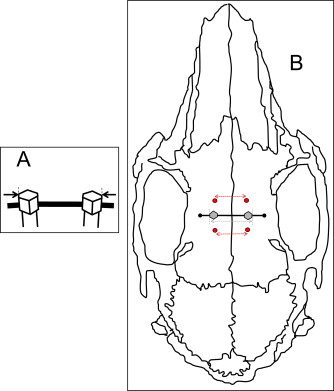
 Four 99.95% tantalum bone markers (1.5 mm long × 0.8 mm in diameter) were tapped into the skull 2 to 3 mm anterior and 2 to 3 mm posterior to the MSIs by using a custom-made stainless steel appliance. The bone markers were used to radiographically quantify the sutural separation and implant movements. All animals were given penicillin (60000 IU/lb/im) immediately after surgery to prevent infection and buprenorphine (0.02 mg/kg/sc; prn) to minimize discomfort.
A 20-mm long and 0.020-in diameter stainless steel interabutment guide wire was engaged in the holes in the MSI heads ( Fig 1 , D ). Fifteen-millimeter long Sentalloy (GAC International, Bohemia, NY) nickel-titanium open-coil springs, delivering 50, 100, or 200 g of force, were telescoped over the wire between the 2 MSIs. Two stop loops were bent to prevent the spring and wire from becoming dislodged. The forces exerted were maintained because the springs remained compressed at lengths ranging from 8 to 12 mm, and the springs’ lengths were checked biweekly. When necessary, sliding tubes were added to the guide wire to maintain the springs’ compressed lengths.
Records, including animal weights, ventrodorsal cephalometric digital radiographs, and inter-MSI width caliper measurements, were obtained under anesthesia at days 0, 14, 28, and 42 ( Fig 3 ). By using a customized head holder and a metal scale for calibration, standardized ventrodorsal radiographs (no. 4 film; Air Techniques, Melville, NY) were taken at 65 kVp and 10 mA for 12 seconds at fixed distances.
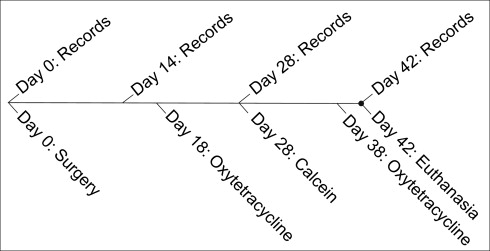
To quantify bone formation, oxytetracycline (13.6 mg/lb/im) and calcein (10 mg/kg/im) fluorescent labels were administered to all animals. Oxytetracycline was given on days 18 and 38; calcein was given on day 28. It was previously shown that advancing bone fronts during sutural expansion incorporate fluorescent labels, making it possible to quantify new bone formation.
Blinded biometric assessments were based on caliper and radiographic measurements. Caliper width measurements between each MSI pair (MSIc) were taken at the outermost margins immediately above the guide wire ( Fig 2 , A ). The widths between the anterior (AB) and posterior (PB) bone markers and outermost margins of the MSI (MSIr) were measured on the digital radiographs ( Fig 2 , B ) by using Visix software (Air Techniques). After 2 weeks, 80 radiographs were remeasured for establishing the intraexaminer method errors (AB, 0.11 mm; MSIr, 0.10 mm; PB, 0.10 mm) by using Dahlberg’s formula ( [∑d2/2n]−−−−−−−−√
[ ∑ d 2 / 2n ]
).
To estimate sutural separation at the implant site, the AB and PB widths were averaged. The MSI lateral displacement during the study was determined by subtracting sutural separation from changes in MSIr width between days 0 and 42. The parallel nature of sutural separation was evaluated based on the differences between the AB and PB widths changes during the study.
After 42 days of expansion, the rabbits were killed with an overdose of beuthanasia (intracardiac injection of 1 cm per animal) and perfused with 70% ethanol. A standardized region, including the midsagittal suture and adjacent bone, was dissected and fixed with 70% ethanol for 2 weeks without decalcification. After dehydration with an ascending series of ethanol (70%-100%), the specimens were embedded in methylmethacrylate and sectioned (approximately 60 μm) coronally by using a diamond saw (3 sequential sections per animal), followed by grinding and polishing.
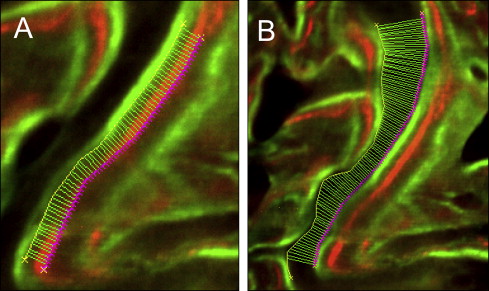
Images were captured by an 80i epifluorescence microscope (Nikon, Melville, NY; excitation wave lengths of 390 nm for oxytetracycline and 485 nm for calcein) with a Coolsnap K4 (Photometrics, Tucson, Ariz) camera and MetaMorph software (version 6.3, Molecular Devices, Sunnyvale, Calif). Bioquant Osteo II software (Nashville, Tenn) was used to trace the bone labels over the entire suture, from the ectocranial to the endocranial surfaces. All data processing was performed by 1 blinded examiner (S.S.-Y.L.). Bone formation between the leading edges of label pairs was automatically measured every 10 μm along the entire length of the suture ( Fig 4 ). The first pair of labels quantified bone formation between day 18 (oxytetracycline) and day 28 (calcein); the second pair quantified bone formation between day 28 (calcein) and day 38 (oxytetracycline). Sutural gaps after expansion were measured every 10 μm between the 2 trailing edges of the bone labels at day 38 (oxytetracycline). Measurements of bone formation and sutural gaps were based on the averages of the 3 serial sections obtained for each animal.