Introduction
The aim of the study was to determine the most accurate threshold value for airway volume quantification based on specific experimental conditions.
Methods
Ten scans from the airway prototype were obtained by using cone-beam computed tomography. The volume from each scan was measured with 8 values (25, 50, 70, 71, 72, 73, 74, and 75) of the threshold tool from the Dolphin software (Dolphin Imaging and Management Solutions, Chatsworth, Calif). The gold standard method used was the actual volume of the airway prototype, which was compared with the different threshold values. An intraclass correlation coefficient test was applied to evaluate the intraexaminer calibration and verify differences among the airway volumes measured in all cone-beam computed tomography scans. Analysis of variance with the Tukey post-hoc test was used to compare differences among the measurements with different threshold values with the gold standard.
Results
The intraexaminer reliability was confirmed by the intraclass correlation coefficient, which was ≥0.99. The intraclass correlation coefficient used to verify the differences among the airway volume measurements in all cone-beam computed tomography scans was ≥0.98, showing that they were comparable. Analysis of variance and the Tukey post-hoc test showed that the volumes measured with the threshold values of the 25 and 50 filters had statistically significant differences from the gold standard. However, volumes measured with the threshold values of the 70, 71, 72, 73, 74, and 75 showed no statistically significant differences from the gold standard and among them.
Conclusions
In our study for the cone-beam machine and the acquisition parameters used, the threshold value of the 73 used in Dolphin 3D software was the most accurate to measure airway volume, but the threshold values of the 70, 71, 72, 74, and 75 had no statistically significant differences compared with the gold standard, showing they are also reliable.
Since the introduction of cone-beam computed tomography (CBCT) imaging in dentistry, several studies have evaluated airway volume with different 3-dimensional viewer softwares. It was said that the use of CBCT technology for airway evaluation increases the accuracy and the reliability of the measurements. This is because the resulting volumes from the digital data can be manipulated in the 3 axes (sagittal, coronal, and axial), selectively contrasted, emphasized, and reduced to visualize certain anatomic structures such as the airway.
Yamashina et al used a soft-tissue equivalent phantom to evaluate the reliability and accuracy of CBCT in measuring the density values of air, water, and soft tissues. They concluded that the measurement of the air space surrounded by soft tissues was quite accurate, and that the airway volume acquired from CBCT images is nearly a 1-to-1 representation of the real volume. However, El and Palomo evaluated 3 commercially available softwares and showed that, in the Dolphin 3D Imaging software (Dolphin Imaging and Management Solutions, Chatsworth, Calif), despite its high reliability, the accuracy was poor. That means that the measurements were overestimated or underestimated compared with the actual volumes. Although the Dolphin 3D software gives good control because it allows the user to increase or decrease the threshold value, that can be deceitful. Sometimes filling an empty space in the airway by increasing the threshold can result in overflow of the volume into another region.
Threshold is a Dolphin tool that controls the filling degree of the airway. During airway space analysis, after drawing the border around the selected portion, the operator chooses a threshold value, and then the software automatically fills in and displays all the airway space within that border. However, the results of airway volume can vary according to the threshold chosen. Generally, the increase or decrease of the threshold results in a greater or smaller airway volume, respectively.
There is no standardization of the ideal threshold value to achieve the actual volume. Thus, the purpose of this study was to determine the most accurate threshold value for airway volume quantification based on specific experimental conditions.
Material and methods
This study was revised and approved by the research ethics committee of the Institute of Collective Health Studies of the Federal University of Rio de Janeiro in Brazil.
Initially, to obtain the airway prototype, 1 CBCT scan was randomly selected from the archive at the Department of Orthodontics of Federal University of Rio de Janeiro. The CBCT machine used was the i-CAT (Imaging Sciences International, Hatfield, Pa), and the scanning protocol was 120 kV, 5 mA, 13 × 17 cm field of view, 0.25-mm voxel, and a scanning time of 40 seconds. Data were imported in the digital imaging and communications in medicine (DICOM) format and the 3-dimensional head rendering of each patient was oriented by using Mimics software (version 10.11; (Materialise Medical, Leuven, Belgium) by the same investigator (M.A.).
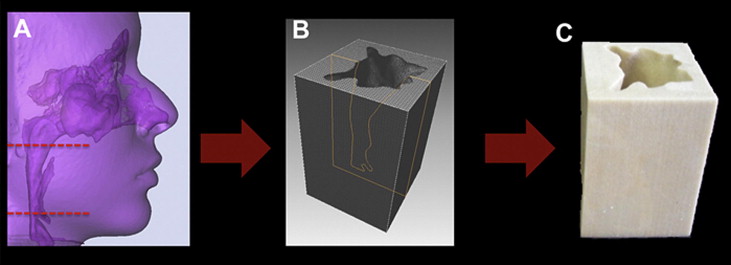
Then the portion of the airway of interest was defined with a specific airway analysis tool from the Mimics software. The superior border was defined from the edge of the hard palate to the posterior wall of the pharynx (parallel to the Frankfort horizontal), and the inferior border from the tip of the epiglottis to the posterior wall of the pharynx on a plane parallel to the Frankfort horizontal. After updating the software, the airway volume was obtained. A set of axial images (matrix, 0.25 × 0.25 × 0.25-mm voxel) of the oropharyngeal airway was transformed into a 3-dimensional virtual model with the stereolithography native file extension. A prototype was generated with this software through an inverted threshold, which created a negative airway model ( Fig 1 ).
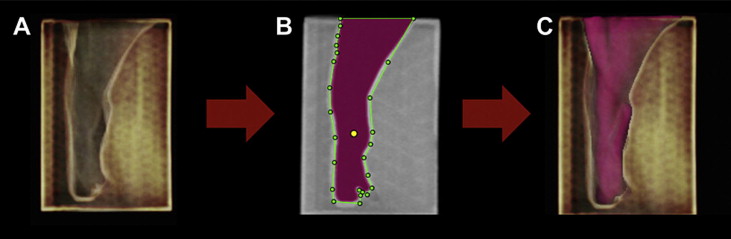
After that, 10 scans were obtained from the prototype in the same CBCT machine. Data were imported in the DICOM format and handled with Dolphin 3D software (version 11; Dolphin Imaging & Management Solutions). The scans were oriented, and the airway analysis tool of this software was used to obtain the airway volume ( Fig 2 ). The volume from each CBCT image (n = 10) was measured with 8 values of the threshold tool from the Dolphin software. The threshold values tested were 25, 50, 70, 71, 72, 73, 74, and 75.
The gold standard method used to obtain the actual volume of the airway prototype was the volume of water necessary to fill the empty space of the prototype measured by high-precision micropipette of 2 to 20 μL (Tedia Pet, Fairfield, Ohio). This procedure was repeated 5 times, and a mean value was computed. This value was compared with the volume measurements obtained with different thresholds.
All measurements were done by the same operator (M.A.). Six CBCT images were randomly selected and remeasured within a 1-week interval. An intraclass correlation coefficient test was applied to evaluate the intraexaminer calibration. Furthermore, the intraclass correlation coefficient test was used to verify differences among the airway volumes measured in all CBCT images to evaluate whether they were comparable. Analysis of variance (ANOVA) with the Tukey post-hoc test was used to compare differences among the measurements with different thresholds and the gold standard, with P <0.05 considered statistically significant.
All statistical analyses were performed by using the SPSS software (version 17.0; SPSS, Chicago, Ill).
Results
The intraexaminer reliability was confirmed by the intraclass correlation coefficient, which was ≥0.99. The intraclass correlation coefficient used to verify the differences among the airway volume measurements in all CBCT images was ≥0.98, showing that they were comparable.
The mean value of the actual volume obtained directly from the prototype was 20514.16 mm 3 (±1.75). This was used as the gold standard value, with which the volumes from the various thresholds in the Dolphin software were compared. The Table shows the means and standard deviations for the volumes measured with each threshold and the gold standard.
| Threshold values | Mean (SD) (mm 3 ) | Tukey HSD post-hoc test ∗ |
|---|---|---|
| 25 | 11880.38 (1034.62) | A |
| 50 | 18044.02 (154.30) | B |
| 70 | 20121.10 (121.31) | C |
| 71 | 20247.56 (115.05) | C |
| 72 | 20376.24 (107.96) | C |
| 73 | 20470.96 (112.39) | C |
| 74 | 20572.52 (124.37) | C |
| 75 | 20689.48 (123.86) | C |
| Gold standard | 20514.16 (1.75) | C |
Stay updated, free dental videos. Join our Telegram channel
VIDEdental - Online dental courses


