Introduction
In this study, we aimed to examine the role of intermittent hypoxia (IH) in dentofacial morphologic changes in growing rats.
Methods
Seven-week-old male rats were exposed to IH at 20 cycles per hour (nadir of 4% oxygen to peak of 21% oxygen) for 8 hours per day for 6 weeks. Control rats were exposed to normoxia (N). Maxillofacial growth was compared between the 2 groups by linear measurements on cephalometric radiographs. To examine the dental arch morphology, study models and microcomputed tomography images of the jaws were taken. Additionally, tongue size was measured.
Results
The gonial angle and the ramus of the mandible were smaller in the IH group than in the N group, whereas the body weights were not different between the 2 groups. Morphometric analysis of the dentition showed a significantly wider mandibular dentition and narrower maxillary dentition in the IH than in the N group. The relative width (+4.2 %) and length (tongue apex to vallate papillae, +3.5 %) of the tongue to the mandible were significantly greater in the IH group than in the N group.
Conclusions
IH induced dentofacial morphologic discrepancies in growing rats.
Highlights
- •
We exposed growing rats to intermittent hypoxia.
- •
Intermittent hypoxia does not disrupt general growth in rats.
- •
Intermittent hypoxia can restrict mandibular growth in rats.
- •
Intermittent hypoxia impacts arch dimensions and tongue size in rats.
- •
Effects of intermittent hypoxia might be associated with craniofacial changes in children.
Anatomic imbalances between the upper airway soft tissues and the craniofacial dimensions, a lower hyoid bone position, and abnormal upper airway neuromotor tone have been implicated in the development of obstructive sleep apnea (OSA) in children. Children at high risk for sleep-disordered breathing exhibit mandibular retrognathia with a palatal crossbite and narrowed dentoalveolar transverse width in the maxillary dental arch. These dentofacial characteristics are associated with reduced nasopharyngeal and oropharyngeal sagittal dimensions. Additionally, distinct correlations have been shown among maxillary constriction, nasal air resistance, and OSA severity. The effectiveness of various corrective measures for dentofacial morphologic changes in children with OSA has demonstrated that such morphologic changes contribute to the development and progression of OSA. Hyoid-mandibular narrowing and tongue enlargement predict the severity of OSA and the likelihood of its treatability by continuous positive airway pressure in patients. Moreover, hypertrophy of the tongue base and root can induce pharyngeal obstruction, which can be treated with radiofrequency volumetric tissue reduction of the tongue.
Pediatric OSA is a multifactorial disorder with a variety of causes, including obesity and related metabolic diseases, prematurity, nasal abnormalities, and adenotonsillar hypertrophy. In adults, the most common cause of OSA is obesity associated with excessive soft tissues in the mouth and throat areas. Obesity is also associated with an increase in the systemic inflammation commonly found in children with OSA. However, OSA in the nonobese population is often reported in children and adults. Thus, pediatric OSA is not necessarily restricted to obese children. Although childhood obesity might be related to OSA, it is much less commonly associated with the condition than is adult obesity. Left untreated, OSA can lead to further serious complications in children, including neurocognitive impairment and cardiovascular disease. A parallel study of identical twins from 17 cases of nonobese children with OSA demonstrated differential growth and hormonal balance between OSA and non-OSA siblings despite the same genetic background. However, there is controversy related to the development of pediatric OSA and impaired orofacial growth due to multifactorial disorders.
Repetitive episodes of oxygen desaturation during sleep underlie the pathology of pediatric OSA. The ventilatory responses to these episodes are weaker in children than in adults with OSA. Sustained hypoxia induces sternohyoid muscle maladaptation in growing rats, and brainstem hypoxia elicits selective upper but not lower respiratory muscle depression. It is possible that OSA in young children can cause intermittent hypoxia (IH), which may lead to improper jaw development and worsening of respiratory function, although no research addressing these possibilities has been published. No reports have described the role of IH in the osteogenesis of the craniofacial skeleton in vivo, so the fundamental question is whether IH can induce craniofacial bone changes related to the development of the micromandible.
The growth spurt stage of the maxillofacial bones differs from that of the longitudinal bones and neural crest; boys undergo mandibular skeletal growth during adolescence. In rats, the maxillofacial bones undergo striking growth and development from prepubertal to young adult periods. In this study, we investigated the effects of IH on the dentofacial bones and tongues of prepubertal rats. The experimental design attempted to isolate IH in pediatric OSA from other factors that might affect skeletal growth and bone metabolism (eg, dietary differences) to clarify the possible effects of the respiratory disturbance on skull growth.
Material and methods
The experimental procedures were performed according to the Guide for the Care and Use of Laboratory Animals published by the U.S. National Institutes of Health (NIH publication 85-23, revised 1996) under a protocol approved by the Institutional Animal Care and Use Committee of the University of Tokyo (P12-149). Seven-week-old male Sprague-Dawley rats were divided into 2 groups: the experimental group underwent IH at 20 cycles per hour (nadir, 4% oxygen; peak, 21% oxygen; 0% carbon dioxide) (IH group), and the normoxia (N) group was exposed to normoxic conditions (room air). The animals were housed in the same plastic cage placed next to the cage equipped with the IH apparatus for 8 hours per day during the 12-hour “lights on” period, as previously described. The noise level for the N group was similar to that of the IH group in the adjacent cages to minimize noise stress-related differences. Moreover, the rats were pair fed to exclude dietary effects on growth. After 6 weeks, the rats were anesthetized with an intraperitoneal injection of sodium pentobarbital and killed by cervical dislocation.
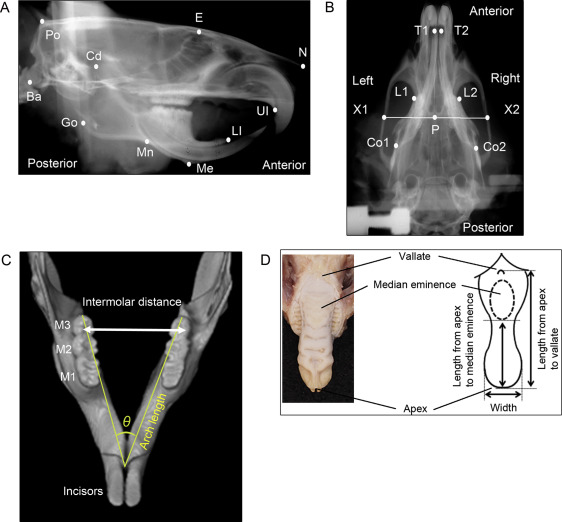
Cephalometric analysis of the craniofacial skull was performed after the experimental period. Lateral and dorsoventral cephalometric radiographs were taken with a soft x-ray machine (CMB-2; SOFTEX, Tokyo, Japan) to evaluate craniofacial growth. The head position of each rat was fixed with a pair of ear rods. The sagittal and transverse cephalometric radiograph settings were 50 kVp and 15 mA with 5-second impulses. Thirteen lateral and 6 dorsoventral landmarks were identified on the cephalometric radiographs to measure craniofacial growth by an author (Y.K.) ( Fig 1 , A and B ): the most posterior and superior ends of the skull, the intersection between the frontal bone and floor of the anterior cranial fossa, the most anterior ends of the nasal bone, the most posterior and inferior ends of the occipital condyle, the most superior ends of the mandibular condyle, the most posterior ends of the mandibular ramus, the most concave portion of the inferior border of the mandibular corpus, the most inferior and anterior points of the lower border of the mandible, the most inferior and anterior points of the alveolar bone of the maxillary incisor, and the anterior and superior ends of the alveolar bone of the mandibular incisor. Cephalometric analysis of the dorsoventral radiograph was performed by evaluating the following points to quantify craniofacial growth ( Fig 1 , B ): the posterior end of the palate on the midline, the points on the lateral portion of the zygomatic arch that pass the posterior end of the palate on the midline, the most anterior and medial points within the bilateral temporal fossae, the anterior end of the mandible on the concavity of the mandibular left and right incisors, and the posterior end of the mandibular body on the left and right. Each measurement was repeated and double-checked 3 times.
Fifteen linear distances between the cephalometric landmarks were measured using digital imaging software (Photoshop CS6 Extended; Adobe Systems, San Jose, Calif) as previously described. Sagittal distances were measured for the total skull length, cranial vault length, and posterior neurocranium height in the neurocranium; nasal bone length and midface length in the viscerocranium; and total mandibular length from the condylar head to the mandibular incisor, total mandibular length from the condylar head to menton, ramus height from the condylar head to the inferior border of the mandibular corpus, total corpus length, posterior corpus length, and anterior corpus length in the mandible. Transverse distances on dorsoventral radiographs were measured for the bizygomatic width, palatal width, and mandibular body width.
After 6 weeks of IH, precise impressions of the mandibular and maxillary dental arches were acquired with rubber-based dental impression material (Exafine; GC, Tokyo, Japan) for measurements of dental arch width, length, and angle. The width and length of each dental arch were measured 3 times on a study model made of resin-fortified, low-expansion die stone (ResinRock; Whip Mix, Louisville, Ky) according to a previous report. The intermolar distances between the outermost points on the buccal crown surfaces of the bilateral molars were measured with a sliding caliper (YS-32; YDM, Tokyo, Japan) to obtain the maxillary and mandibular dental arch widths ( Fig 1 , C ). The dental arch length was measured as the distance from the lingual gingival margin between the bilateral central incisors to the distal ends of the bilateral third molars. The ratio of the maxillary to mandibular dental arch widths was calculated to check the discrepancy between the maxillary and mandibular transverse dental arches.
The maxilla and mandible were separately scanned with a phantom by microcomputed tomography (SMX-100CT; Shimadzu, Kyoto, Japan). The arch angle was measured on the appropriate cross section of the reconstructed computed tomography image using 3-dimensional image-analysis software (TRI/3-D-BON; Ratoc System Engineering, Tokyo, Japan) to assess differences in directional arch growth in the horizontal dimension ( Fig 1 , C ).
To evaluate tongue dimensions, the distances between the apex and vallate and between the apex and median eminence of the tongue were measured using the sliding caliper according to the method of Reiner et al ( Fig 1 , D ). Tongue width was measured at the point where the anterior tongue began to curve to form the tongue tip. Tongue size was normalized to the mandibular width and length obtained from the dorsoventral cephalometric analysis.
Statistical analysis
An average of 6 rats per group was proposed in this study based on institutional animal ethics approval and the degree of impaired maxillofacial growth in young rats under IH reported by Kuma et al. Two types of statistical methods were used to calculate appropriate sample size. A preliminary power analysis indicated that 8 rats would be necessary to show impaired maxillofacial growth with α = 0.05 and 80% power. However, the resource equation method is the preferred method of determining sample size, particularly for animal studies. Using this approach, the error difference should be between 10 and 20; the error difference value of this study was 10. Because the variances of growth data obtained in the groups were moderately small and well controlled by pair feeding, the statistical test results provided useful information for our evaluation. Body weights were expressed as means and standard deviations, and morphometric analysis data were expressed as medians and standard errors. Statistical calculations were performed using JMP software (version 10.0; SAS Institute, Cary, NC). We checked the normality and variance of the data using the Shapiro-Wilk normality test and the F test. The Welch t test was used for data with a normal distribution and unequal variance. Linear measurement-based data were compared using the Mann-Whitney U-test for nonparametric data. Differences were considered significant at P <0.05.
Results
The pair-fed rats were exposed to IH or N for 6 weeks, and there was no significant difference in body weight change between the 2 groups after the entire period ( Table I ). Lateral cephalometric images showed distoclusion of the first molar between the maxilla and mandible in the IH group ( Fig 2 , A and B ). Growth retardation in the nasal bone length (−1.10 mm) was observed in the IH rats compared with the N rats ( Table II ). In the sagittal plane, there was no difference in the midfacial length between the IH and N groups. The total size of the mandible was significantly smaller in the IH group than in the N group ( P <0.05). In the mandible, the sagittal dimension of the ramus (−1.05 mm) and gonion (−0.54 mm) regions were significantly smaller in the IH group ( P <0.05) ( Table II ). However, there was no difference between the 2 groups in the anterior portion of the mandibular body ( Table II ).
| IH | N | Mean difference | P value | t value | |||||||
|---|---|---|---|---|---|---|---|---|---|---|---|
| Rats (n) | Mean | SD | SE | Rats (n) | Mean | SD | SE | ||||
| Baseline | 8 | 220.00 | 5.35 | 1.89 | 7 | 220.71 | 9.32 | 3.52 | 0.71 | 0.826 | 0.18 |
| 6 weeks | 8 | 317.50 | 27.12 | 9.59 | 7 | 320.00 | 18.26 | 6.90 | 2.50 | 0.836 | 0.21 |
| Variable | IH | N | Mean difference | P value | t value | ||||||
|---|---|---|---|---|---|---|---|---|---|---|---|
| Samples (n) | Mean | SD | SE | Samples (n) | Mean | SD | SE | ||||
| Neurocranium | |||||||||||
| Po-N (mm) | 6 | 50.56 | 0.63 | 0.26 | 5 | 51.63 | 0.67 | 0.30 | 1.07 | 0.083 | 2.72 |
| Po-E (mm) | 6 | 29.80 | 0.60 | 0.24 | 5 | 30.00 | 1.01 | 0.45 | 0.19 | 0.780 | 0.37 |
| Po-Ba (mm) | 6 | 11.11 | 0.23 | 0.09 | 5 | 11.22 | 0.33 | 0.15 | 0.10 | 0.315 | 0.60 |
| Viscerocranium | |||||||||||
| E-N (mm) | 6 | 21.25 | 0.46 | 0.19 | 5 | 22.35 | 0.33 | 0.15 | 1.10 | 0.008 † | 4.62 |
| Po-UI (mm) | 6 | 46.65 | 0.72 | 0.29 | 5 | 47.18 | 0.62 | 0.28 | 0.52 | 0.235 | 1.29 |
| Ba-UI (mm) | 6 | 45.16 | 1.24 | 0.50 | 5 | 46.33 | 0.47 | 0.21 | 1.17 | 0.055 | 2.13 |
| Mandible | |||||||||||
| Cd-L1 (mm) | 6 | 26.18 | 0.41 | 0.17 | 5 | 27.31 | 0.80 | 0.36 | 1.13 | 0.031 ∗ | 2.86 |
| Cd-Me (mm) | 6 | 23.22 | 0.33 | 0.13 | 5 | 24.43 | 0.78 | 0.35 | 1.21 | 0.023 ∗ | 3.23 |
| Cd-Mn (mm) | 6 | 16.25 | 0.53 | 0.22 | 5 | 17.30 | 0.65 | 0.29 | 1.05 | 0.045 ∗ | 2.40 |
| Go-Me (mm) | 6 | 19.40 | 0.39 | 0.16 | 5 | 20.22 | 0.23 | 0.10 | 0.82 | 0.023 ∗ | 4.34 |
| Go-Mn (mm) | 6 | 11.80 | 0.33 | 0.13 | 5 | 12.33 | 0.20 | 0.09 | 0.54 | 0.036 ∗ | 3.35 |
| Me-Mn (mm) | 6 | 7.92 | 0.25 | 0.10 | 5 | 7.88 | 0.21 | 0.09 | 0.04 | 0.927 | 0.32 |
On the dorsoventral cephalometric radiograph, the bigonial width between the 2 posterior ends of the mandibular body (−0.78 mm) was significantly smaller in the IH group ( P <0.05) ( Table III ). The bizygomatic width and palatal width were not different between the 2 groups.
| Variable | IH | N | Mean difference | P value | t value | ||||||
|---|---|---|---|---|---|---|---|---|---|---|---|
| Samples (n) | Mean | SD | SE | Samples (n) | Mean | SD | SE | ||||
| Neurocranium | |||||||||||
| X1-X2 (mm) | 6 | 23.25 | 0.33 | 0.14 | 5 | 23.30 | 0.45 | 0.20 | 0.05 | 0.784 | 0.20 |
| Viscerocranium | |||||||||||
| L1-L2 (mm) | 6 | 10.64 | 0.13 | 0.05 | 5 | 10.73 | 0.15 | 0.06 | 0.09 | 0.314 | 1.07 |
| Mandible | |||||||||||
| Co1-Co2 (mm) | 6 | 13.35 | 0.62 | 0.25 | 5 | 14.13 | 0.46 | 0.21 | 0.78 | 0.036 ∗ | 2.38 |
Dental arch morphology was compared between the IH and N groups to evaluate the effects of IH on the dental arch growth in rats exposed to IH. The maxillary dental arch was narrower and more tapered, and the mandibular dental arch was shorter in the IH than in the N group ( Table IV ). Morphometric analysis of the dentition showed a significantly wider mandibular dental arch ( P <0.05) and a narrower maxillary arch in the IH group than in the N group ( Table IV ). The arch grew differently with respect to width and length, and the arch angle was significantly greater in the IH than in the N group in the mandible ( P <0.05), but not in the maxilla ( Table IV ). The ratio of the mandibular to the maxillary dental arches was significantly larger in the IH group ( P <0.01), demonstrating a distinct discrepancy between the maxilla and the mandible ( Table V ). However, the lengths of the mandibular arch were different between the IH and N groups.
| Variables | IH | N | Mean difference | P value | t value | ||||||
|---|---|---|---|---|---|---|---|---|---|---|---|
| Samples (n) | Mean | SD | SE | Samples (n) | Mean | SD | SE | ||||
| Intermolar arch width | |||||||||||
| Maxilla | |||||||||||
| M1 (mm) | 6 | 9.13 | 0.35 | 0.14 | 5 | 9.48 | 0.11 | 0.05 | 0.36 | 0.079 | 2.32 |
| M2 (mm) | 6 | 9.20 | 0.26 | 0.11 | 5 | 9.50 | 0.11 | 0.05 | 9.20 | 0.044 ∗ | 2.40 |
| M3 (mm) | 6 | 8.89 | 0.12 | 0.05 | 5 | 9.16 | 0.13 | 0.06 | 0.27 | 0.022 ∗ | 3.59 |
| Mandible | |||||||||||
| M1 (mm) | 6 | 8.81 | 0.28 | 0.12 | 5 | 8.28 | 0.15 | 0.07 | 0.53 | 0.027 ∗ | 3.95 |
| M2 (mm) | 6 | 9.34 | 0.24 | 0.10 | 5 | 8.94 | 0.20 | 0.09 | 0.40 | 0.022 ∗ | 3.03 |
| M3 (mm) | 6 | 9.65 | 0.29 | 0.12 | 5 | 9.17 | 0.34 | 0.15 | 0.48 | 0.067 | 2.50 |
| Arch length | |||||||||||
| Maxillary arch (mm) | 12 | 21.47 | 0.13 | 0.04 | 10 | 21.89 | 0.20 | 0.06 | 0.42 | 0.0004 † | 5.78 |
| Mandibular arch (mm) | 12 | 16.95 | 0.62 | 0.18 | 10 | 16.89 | 0.13 | 0.04 | 0.06 | 0.335 | 0.30 |
| Arch angle | |||||||||||
| Maxillary arch (°) | 6 | 21.90 | 0.46 | 0.19 | 5 | 22.76 | 1.06 | 0.48 | 0.87 | 0.143 | 1.69 |
| Mandibular arch (°) | 6 | 35.68 | 1.27 | 0.52 | 5 | 33.17 | 1.42 | 0.63 | 2.51 | 0.014 ∗ | 3.06 |
Stay updated, free dental videos. Join our Telegram channel
VIDEdental - Online dental courses


