Introduction
The manufacturing process for copper-nickel-titanium archwires is technique sensitive. The primary aim of this investigation was to examine the interlot consistency of the mechanical properties of copper-nickel-titanium wires from 2 manufacturers.
Methods
Wires of 2 sizes (0.016 and 0.016 × 0.022 in) and 3 advertised austenite finish temperatures (27°C, 35°C, and 40°C) from 2 manufacturers were tested for transition temperature ranges and force delivery using differential scanning calorimetry and the 3-point bend test, respectively. Variations of these properties were analyzed for statistical significance by calculating the F statistic for equality of variances for transition temperature and force delivery in each group of wires. All statistical analyses were performed at the 0.05 level of significance.
Results
Statistically significant interlot variations in austenite finish were found for the 0.016 in/27°C ( P = 0.041) and 0.016 × 0.022 in/35°C ( P = 0.048) wire categories, and in austenite start for the 0.016 × 0.022 in/35°C wire category ( P = 0.01). In addition, significant variations in force delivery were found between the 2 manufacturers for the 0.016 in/27°C ( P = 0.002), 0.016 in/35.0°C ( P = 0.049), and 0.016 × 0.022 in/35°C ( P = 0.031) wires.
Conclusions
Orthodontic wires of the same material, dimension, and manufacturer but from different production lots do not always have similar mechanical properties. Clinicians should be aware that copper-nickel-titanium wires might not always deliver the expected force, even when they come from the same manufacturer, because of interlot variations in the performance of the material.
Highlights
- •
There are significant inconsistencies in mechanical properties of CuNiTi wires.
- •
There may be significant differences among production lots of the same wire type from the same manufacturer.
- •
Both austenite start and austenite finish temperatures may impact the performance of CuNiTi wires.
The introduction of copper-nickel-titanium (CuNiTi) archwires to the orthodontic specialty is relatively recent. Although small variations in the ratio of nickel to titanium can have meaningful effects on the mechanical properties of orthodontic archwires, the substitution of copper for some nickel can maintain the shape-memory properties that make nickel-titanium (NiTi) wires so popular, and make the wire more stable and less sensitive to exact proportions in the alloy. The clinically relevant claimed benefits of CuNiTi over NiTi wires include more constant force generation over longer activation spans, greater resistance to permanent deformation, more stable superelasticity characteristics when cyclically loaded, better spring-back, and less hysteresis. Additionally, there have been claims that the CuNiTi manufacturing process allows for more consistent transition temperatures, thus providing controlled force delivery individualized for each patient.
NiTi wires can exist in 1 of 2 different physical states or phases of molecular arrangement: martensite and austenite. Martensite is the pliable, low-temperature state, and austenite is the stiffer, high-temperature state. The transformation temperature range consists of the austenite start (A s ) temperature, when the alloy first begins the transformation from martensite to austenite, and the austenite finish (A f ) temperature, when the transformation is complete and the alloy becomes uniformly austenite. It is well known that the superelastic properties and thus the clinical performance of NiTi archwires directly depend on the transition temperatures of the alloy and the alloy’s potential to undergo molecular changes after mechanical (deflection) or thermal (temperature) stimuli. Therefore, if the addition of copper into the NiTi alloy allows for more consistency in the transition temperature of the produced wires, that should also be directly related to better consistency in clinical performance.
According to the International Standards Organization, an accepted method of determining transition temperatures of superelastic alloys is thermal analysis via differential scanning calorimetry (DSC). In this test, a sample of metal is placed in a controlled chamber and put through a cycle of cooling and heating. As superelastic wires transform through their various phases with temperature changes, enthalpy is measured and graphed. Peaks on the resultant curves represent the temperatures at which the phase changes began and ended, thus allowing determination of the transformation temperature ranges.
Wire properties are extremely sensitive to the alloy ratio; small amounts of dissolved interstitial elements act as impurities and disrupt the NiTi crystal matrix and therefore its transformation behavior. Additionally, the manufacturer-specified parameters for the amount of cold work and the duration and temperature of the heat treatment and annealing processes greatly affect the archwire’s final transition temperature range and therefore its force delivery. Thus, it has been established that wires of similar types from different manufacturers do not necessarily possess similar properties because these manufacturing conditions are not consistent. Furthermore, it is unclear to what extent all of these manufacturing materials and conditions are tightly controlled from production lot to production lot of wires from the same manufacturer. Previous studies have investigated the mechanical and thermal properties of NiTi wires. However, the authors of these studies assumed manufacturing consistency within companies, since nearly all previous wire studies that compared manufacturers used only 1 wire sample from each manufacturer to make comparisons. Bradley et al, examining transition temperature via DSC, first conducted a pilot study and established that “excellent reproducibility was achieved between nominally identical five segment samples of the same NiTi alloy,” leading the authors to conclude that 1 sample from each lot was sufficient to compare the wires from different manufacturers. Interestingly, potential differences between wires made from the same manufacturer—but in different lots—have not been explored. Therefore, the purpose of this descriptive pilot study was to test the potential variability in mechanical and thermal properties among CuNiTi wires with the same advertised characteristics (ie, dimensions, A f ) from the same company to determine whether future in-depth studies of interlot variations are warranted. To our knowledge, no peer-reviewed study detailing the consistency of the NiTi manufacturing process has been published in the orthodontic literature to date.
Transformation temperature range and force delivery are 2 clinically relevant and intimately linked properties of NiTi wires: the force delivered by a wire depends on whether a deflected wire is in the austenitic or martensitic configuration or a mixture thereof. The aim of this in-vitro investigation was to evaluate the interlot consistency in the mechanical properties of CuNiTi orthodontic archwires, by attempting to detect differences in A s , A f , and force delivery between different manufacturers. When this study was conducted, CuNiTi archwires were commercially available from only 2 manufacturers: Rocky Mountain Orthodontics (RMO, Denver, Colo) and Ormco (Glendora, Calif). Therefore, all the CuNiTi archwires tested were provided by those companies.
Material and methods
The experimental sample consisted of CuNiTi wires of 2 dimensions (0.016 and 0.016 × 0.022 in), with variable advertised A f s (27°C, 35°C, and 40°C) and from different production lots. The wires were grouped based on the combination of dimension and A f , so each group consisted of wires with the same dimension and the same A f , but from different production lots. Production lots were determined by the information available on the package of each wire. The exact numbers of each type of archwire used in this investigation are shown in Table I . In total, 39 wire specimens were tested; 24 were Ormco wires, and 15 were RMO wires.
| Manufacturer | Size | Material | Wire specimens tested, each from a different lot (n) | |
|---|---|---|---|---|
| DSC | Three-point bend | |||
| Ormco | 0.016 in | CuNiTi 27°C | 4 | 4 |
| 0.016 × 0.022 in | CuNiTi 27°C | 5 | 5 | |
| 0.016 in | CuNiTi 35°C | 9 | 9 | |
| 0.016 × 0.022 in | CuNiTi 35°C | 4 | 4 | |
| 0.016 × 0.022 in | CuNiTi 40°C | 2 | 2 | |
| RMO | 0.016 in | CuNiTi 27°C | 3 | 3 |
| 0.016 × 0.022 in | CuNiTi 27°C | 3 | 3 | |
| 0.016 in | CuNiTi 35°C | 3 | 3 | |
| 0.016 × 0.022 in | CuNiTi 35°C | 3 | 3 | |
| 0.016 × 0.022 in | CuNiTi 40°C | 3 | 3 | |
| Totals | 39 | 39 | ||
The difference in numbers between the 2 companies was because no more than a few lots were readily available from RMO at the time of the study. The examiner (R.C.P.-R.) tested as many wires per lot as were easily obtainable commercially. It was considered reasonable to begin with the premise that enough precision should exist in the materials manufacturing process from one lot to another so that if even 2 lots of the same wire type from the same manufacturer showed significant differences in mechanical properties, important clinical implications could be made, or at least this would elicit the potential need for future studies. Wires from the same manufacturer and the same production lot were assumed to be identical at a molecular level, and therefore only 1 specimen from each lot was used to test the mechanical properties of the lot.
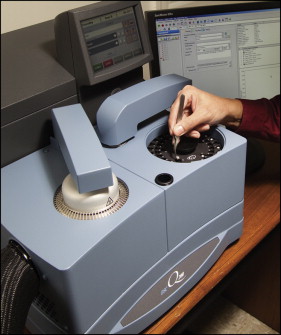
To evaluate the consistency of transition temperature ranges, each wire specimen was tested via thermal analysis with DSC (TA Instruments-Waters, New Castle, Del) as shown in Figure 1 . In preparation for DSC analysis, the wires were sectioned in approximately 4-mm segments weighing approximately 3.5 mg, taken from the posterior area of each sample arch form.
Each wire segment was weighed to the nearest 0.01 mg, placed in an aluminum crucible, and sealed. An empty aluminum crucible served as the reference during the DSC measurements. The temperatures of the crucibles were scanned with nitrogen gas coolant from 60°C to −60°C and back to 60°C to protect the stability in the cell. Heating was achieved with electric heat.
Each wire specimen and reference chamber were heated and then cooled at 10°C per minute. The DSC plots were qualitatively and quantitatively analyzed by the DSC manufacturer’s software, Universal Analysis 2000 (TA Instruments-Waters). Onset and end-set temperatures of the martensitic and austenitic phases were derived from the graphs produced by the software according to standard transition temperature determination methods.
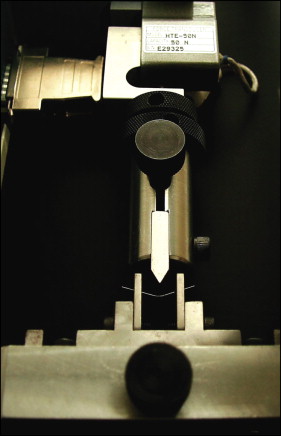
To measure the force produced by a wire as it returns to its original shape after it has been deflected, in other words, the force experienced by teeth as they are moved by a wire, a 3-point bending test was conducted by an examiner (R.C.P.-R.) using the Tinius Olsen HIKS testing machine (Tinius Olsen, Horsham, Pa). The test was performed in accordance with ISO 15841 standard. The machine has 2 stainless steel fulcrums 10 mm apart between their respective centers to serve as supporting points for the wire specimen, shown in Figure 2 . The entire apparatus was housed in a closed chamber maintained at 37°C to simulate average oral temperature.
All wires were sectioned into 20-mm-long specimens, rested across the 2 supporting points, and left in the temperature-stabilized testing chamber for 3 minutes, allowing the wire to reach the chamber temperature. Then each specimen was deflected from 0 to 3.1 mm and back to 0 mm with a stainless steel pointed bar measuring 0.1 mm at its head, traveling at a speed of 10.0 mm per minute. A computer attached to the testing machine recorded 1000 data points for the force placed on and delivered by the wire through the entire loading and unloading process. Rectangular wires were measured under vertical loads that were applied on their long sides, mimicking the forces that teeth would experience when being leveled occlusogingivally. To eliminate variability from cyclic loading, measurements were taken only on specimens that had never been tested or deflected before. To compare forces upon unloading, values recorded at 2 mm of deflection were used for all statistical analyses.
Statistical analysis
To determine the statistical significance of the interlot variances between manufacturers in A s and A f temperatures for each type of wire sampled, the F test of equality of variances was conducted using the statistical software R (version 2.11.1; R Development Core Team, GNU Corporation, Auckland, New Zealand). The F test was also used to compare the variances of the force exerted by each wire on unloading, at 2 mm of deflection during the 3-point bend test.
One-sample t tests were performed to compare the mean A f temperatures to those reported by the manufacturer. All statistical analyses were performed at the P ≤0.05 level of significance.
Results
The average A s and A f temperatures for each type of wire tested, along with descriptive statistics detailing the spread of data in each group, are summarized in Table II . Also, the graphs produced by the DSC testing machine are presented in Figures 3 and 4 .
| Wire (no. of specimens tested) | A s experimental mean | A s experimental range | A s SD | A s P value (F statistic) | A f reported | A f experimental mean | A f experimental range | Average difference from reported | A f SD | A f P value (F statistic) | A f to reported P value (t statistic) |
|---|---|---|---|---|---|---|---|---|---|---|---|
| RMO 0.016 in/27°C (3) | 16.31 | 0.43 | 0.43 | 27.00 | 28.52 | 0.71 | −1.52 | 0.39 | |||
| Ormco 0.016 in/27°C (4) | 5.69 | 3.57 | 1.56 | 27.00 | 24.98 | 6.10 | 2.02 | 2.69 | |||
| 0.14 | 0.041 ∗ | 0.627 | |||||||||
| RMO 0.016 in/35°C (3) | 18.25 | 2.78 | 1.44 | 35.00 | 31.34 | 2.35 | 3.66 | 1.18 | |||
| Ormco 0.016 in/35°C (9) | 14.75 | 12.94 | 4.49 | 35.00 | 34.11 | 7.17 | 0.89 | 2.35 | |||
| 0.194 | 0.432 | 0.110 | |||||||||
| RMO 0.016 × 0.022 in/27°C (3) | 12.53 | 3.47 | 1.74 | 27.00 | 26.36 | 3.31 | 0.64 | 1.66 | |||
| Ormco 0.016 × 0.022 in/27°C (5) | 4.76 | 12.98 | 5.14 | 27.00 | 25.05 | 6.81 | 1.95 | 3.22 | |||
| 0.211 | 0.443 | 0.160 | |||||||||
| RMO 0.016 × 0.022 in/35°C (3) | 15.40 | 0.82 | 0.42 | 35.00 | 30.00 | 0.71 | 5.00 | 0.36 | |||
| Ormco 0.016 × 0.022 in/35°C (4) | 12.39 | 12.39 | 5.74 | 35.00 | 32.17 | 5.18 | 2.83 | 2.29 | |||
| 0.010 † | 0.048 ∗ | 0.136 | |||||||||
| RMO 0.016 × 0.022 in/40°C (3) | 21.11 | 2.22 | 1.12 | 40.00 | 33.26 | 1.12 | 6.74 | 0.57 | |||
| Ormco 0.016 × 0.022 in/40°C (2) | 22.29 | 3.46 | 2.45 | 40.00 | 34.54 | 0.32 | 5.46 | 0.23 | |||
| 0.319 | 0.540 | 0.063 |
Stay updated, free dental videos. Join our Telegram channel
VIDEdental - Online dental courses


