Introduction
The aim of this prospective evaluation was to assess changes in esthetic self-perception of Brazilian adolescents who were receiving fixed orthodontic treatment during a 2-year period.
Methods
The treatment group consisted of 92 patients, ages 12 to 15 years, treated at the Rio de Janeiro State University orthodontic clinic. The control group consisted of 226 untreated adolescents; 124 subjects were waiting for treatment at this clinic, and 102 subjects were attending public school and had never undergone or sought treatment. The index of orthodontic treatment need was used to assess malocclusion severity, esthetic status (measured by an orthodontist), and esthetic self-perception. All subjects were interviewed 3 times during the study: at baseline; 1 year after placement of the fixed appliance for the treatment group and 1 year after the first interview for the school and waiting groups; and 2 years after placement of the fixed appliance for the treatment group and 2 years after the first interview for the school and waiting groups. The index of orthodontic treatment need scores were analyzed by using negative binomial regression in generalized estimating equations for correlated data.
Results
During the follow-up period, the treatment group’s esthetic self-perception scores had a statistically significant decrease ( P <0.01), the waiting group’s scores had an increase ( P = 0.08), and the school group’s scores were stable ( P = 0.79). At baseline, the treatment group had an esthetic self-perception score of 96% (risk ratio = 1.96; 95% confidence interval, 1.70-2.26) higher than the school group, but at the final interview, the treatment group’s score was 20% lower (risk ratio = 0.81; 95% confidence interval, 0.68-0.96) than the initial score of the school group. Age; sex; the index of decayed, missing, and filled teeth; and socioeconomic position did not affect the adolescents’ esthetic self-perceptions at follow up, but malocclusion severity and the group had a significant interaction.
Conclusions
Fixed orthodontic treatment in patients 12 to 15 years of age significantly improved their esthetic self-perceptions.
It has long been recognized that many people seek and undergo orthodontic treatment not to address dental irregularities that might lead to physiologic dysfunction or to prevent destruction of tissues in the oral cavity, but to improve esthetic impairment. In studies of children preparing for orthodontic treatment, the parents’ and patients’ concerns and expectations about improved oral esthetics from orthodontic treatment were strong, and sometimes stronger than the expectations regarding improved oral function.
Even though the demand for orthodontic treatment is mostly related to concerns about personal appearance and esthetics, there are relatively few studies on the effects of orthodontic treatment on the esthetic self-perceptions of patients. There is a growing need to assess patient well-being after treatment, but research has only recently begun to address whether these expectations about the self-perceived benefits of orthodontic treatment are warranted.
Some authors found that, after orthodontic treatment, adult patients reported a higher perceived treatment need than did their untreated peers. One study found no difference among treated and untreated subjects with malocclusion, by using 3 self-perception scales, in a sample of first-year university students who reported having or not having previous orthodontic treatment. In contrast with these findings, Kerosuo et al and Bernabé et al reported that orthodontic treatment had a positive effect on young adults’ self-perceived dental treatment need. Both found better self-perceived dental appearance among treated young adults using the index of orthodontic treatment need-aesthetic component scale and a visual analog scale, respectively. In these studies, previous orthodontic treatment was assessed based on patients’ reports, but the changes in patients’ occlusions, before and after orthodontic treatment, were not known. Consequently, this component of orthodontic treatment effectiveness remains unresolved in the literature.
The objective of this prospective study was to assess whether fixed orthodontic appliance therapy affects the esthetic self-perceptions of Brazilian adolescents aged 12 to 15 years over 2 years. We also sought to determine whether a patient’s oral clinical condition and social status could influence this perception.
Material and methods
All 225 adolescents who were scheduled to undergo orthodontic treatment evaluation at the clinic of the Department of Orthodontics at Rio de Janeiro State University in 2006 were eligible to participate in the study. Because 9 parents did not allow their children to participate (4% loss; 77.7% girls, 22.3% boys), 216 adolescents comprised the source population for the treatment and waiting groups. Only 92 adolescents were selected by the professors of the orthodontic clinic to start fixed appliance treatment, according to the patient’s type of malocclusion and the educational needs and resources of the clinic. Those 92 adolescents composed the treatment group. The 124 unselected adolescents were added to a waiting list of eligible patients. They composed the waiting group and could be called at any time to begin treatment. When patients were called, they were immediately taken out of the research and considered a loss to the sample. The process of selecting a patient for treatment was completely independent of the research and was not influenced by it.
A third group, the school group, comprised all 124 age-matched adolescents who were enrolled in a public school next to the university clinic. Along with the consent form, their parents were sent a questionnaire asking whether their children had already sought or undergone orthodontic treatment. Twenty-two adolescents were excluded because they did not bring back the consent form or reported having previously sought or had orthodontic treatment.
Thus, the study population consisted of 318 adolescents, aged 12 to 15 years, distributed into 3 groups: treatment group (n = 92), waiting group (n = 124), and school group (n = 102). There was no sample size calculation, since all eligible subjects were recruited. Assuming a normal distribution, this study had 100% of power to detect a statistically significant difference over time at P <0.01, with baseline sample of 87 subjects (treatment group over time), and 2 repeated measures for the index of orthodontic treatment need-esthetic component, with the means and standard deviations observed (at baseline, 4.09 [SD, ± 2.11]; after 2 years, 1.26 [SD, ± 0.56]).
All subjects completed 3 interviews and clinical evaluations. The first data collection occurred before the beginning of the treatment for the treatment group and was contemporaneous with the first interviews of the waiting and school groups in 2006 (T1). The second time of data collection occurred 1 year after placement of the fixed appliances for the treatment group and 1 year after the first interviews of the school and waiting groups (T2). The third data collection took place 2 years after placement of the fixed appliances for the treatment group and 2 years after the first interviews of the school and waiting groups (T3).
One trained orthodontist (D.F.) collected the data. Malocclusion severity and orthodontic esthetic impairment were measured by using the dental health component and the aesthetic component of the index of orthodontic treatment need, respectively. Esthetic impairment, measured by the index of orthodontic treatment need-aesthetic component, was also evaluated by the adolescents themselves. Dental health status was determined by using the index of decayed, missing, and filled teeth according to the World Health Organization’s diagnostic criteria. Socioeconomic status was measured with the Brazil Economic Classification Criteria, which classifies people into 5 socioeconomic categories (ie, A and B, high socioeconomic status; C, medium socioeconomic status; D and E, low socioeconomic status) according to the educational level of the head of the household, and the ownership and consumption of common goods and services (eg, VCRs, DVDs, color TVs, maid).
The students in the school group were examined in their school’s dental office under conditions similar to those of the university where the treatment and the waiting groups were examined and by the same orthodontist. The examiner (D.F.) had been trained in the use of the index of orthodontic treatment need by a senior researcher (J.A.M.M.) (gold standard) with broad experience with this occlusal index. The senior researcher had been previously calibrated for the index of orthodontic treatment need assessment in a course taken at the University of Manchester in the United Kingdom. The training process included examination of a set of 20 plaster casts by both the examiner and the senior researcher, and subsequent comparison of their results. To assess intraexaminer reliability, 26 adolescents were reinterviewed and reexamined within 7 to 10 days of the first assessment.
This research was approved by the ethics research committee of Rio de Janeiro State University (1417 CEP/HUPE) where this study was performed, and the parents received a letter describing the study and requesting consent for their children to participate.
Statistical analysis
The main outcome variable was the index of orthodontic treatment need-aesthetic component of each subject, analyzed as a discrete variable. Preliminary analysis showed that the index of orthodontic treatment need-aesthetic component followed an overdispersed Poisson distribution (likelihood test of overdispersion, P <0.001). Therefore, we used negative binomial regression. Alternative models, such as ordinal logistic regression, did not converge. The exponentiated coefficients can be interpreted as mean score ratios. To factor in the temporal correlation of the 3 assessments, we used generalized estimating equations with fixed coefficients (population-average model) and a first-order auto-regressive covariance structure. In this way, we clustered the observations of each subject in temporal order (T1, T2, T3). The group variable (school, treatment, and waiting list) was the exposure of interest. Sex; age at baseline; index of decayed, missing, and filled teeth; index of orthodontic treatment need-dental health component; and economic class were considered as potential confounding factors. The adjusted model was based on backward stepwise regression with P >0.20 for removal.
All analyses were performed with Stata software (version 11.2; StataCorp, College Station, Tex). Descriptive statistics were used to describe the main characteristics of the study population. Differences in the distribution of the covariates among the groups were tested by using a nonparametric test suitable for repeated measurements and ordinal variables when appropriate.
Results
For both the dental health component (kappa = 0.88 [95% CI, 0.86-1.0]) and the aesthetic component (kappa = 0.81 [95% CI, 0.79-1.0]) of the index of orthodontic treatment need, the examiner showed good agreement with the senior researcher. Intraexaminer reliability indicated a substantial consistency of the clinical measurements (kappa = 0.98 for the aesthetic component [95% CI, 0.96-1.0]; kappa = 0.96 [95% CI, 0.90-1.0] for dental health component; and kappa = 1.0 for the index of decayed, missing, and filled teeth). The kappa coefficient for the aesthetic self-perception was 0.93 (95% CI, 0.90-1.0), and the test-retest reliability values for the aesthetic self-perception were similar among the 3 groups.
At T1, the mean ages of the subjects in the treatment, waiting, and school groups were 13.4, 13.7, and 13.7 years, respectively. Overall, the 3 groups were balanced for sex and scores on the index of decayed, missing, and filled teeth. However, differences were observed in socioeconomic status distribution, dental health component, aesthetic component-examiner, and aesthetic component-self scores. Self-perceived esthetics and malocclusion severity were worse in the treatment and waiting groups ( Table I ). The scores of the index of decayed, missing, and filled teeth were low, and the proportion of decayed, missing, and filled teeth was generally higher in the posterior areas than in anterior areas in all groups (data not shown).
| School | Waiting | Treatment | ||||
|---|---|---|---|---|---|---|
| % | n | % | n | % | n | |
| Sex | ||||||
| Male | 41.2 | 42 | 48.4 | 60 | 51.1 | 47 |
| Female | 58.8 | 60 | 51.6 | 64 | 48.9 | 45 |
| Socioeconomic status ∗ | ||||||
| A1, A2 | 0 | 0 | 2.4 | 3 | 0 | 0 |
| B1 | 2.0 | 2 | 12.9 | 16 | 3.3 | 3 |
| B2 | 16.7 | 17 | 22.6 | 28 | 10.9 | 10 |
| C1 | 65.7 | 67 | 55.7 | 69 | 23.9 | 22 |
| C2 | 0 | 0 | 0 | 0 | 59.8 | 55 |
| D, E | 15.7 | 16 | 6.5 | 8 | 2.2 | 2 |
| Mean | n | Mean | n | Mean | n | |
|---|---|---|---|---|---|---|
| Age (y) | 13.7 | 102 | 13.7 | 124 | 13.4 | 92 |
| IOTN-DHC | 3.0 | 102 | 3.4 | 124 | 3.5 | 92 |
| IOTN-AC, examiner | 3.9 | 102 | 4.5 | 124 | 4.6 | 92 |
| IOTN-AC, self-perceived | 1.9 | 102 | 4.0 | 124 | 4.1 | 92 |
| DMFT | 1.3 | 102 | 1.4 | 124 | 1.5 | 92 |
Dropout rates were 5.4% (5 adolescents) in the treatment group, 18.5% (23 adolescents) in the waiting group, and 5.9% (6 adolescents) in the school group. Of the 33 subjects who were lost to follow-up, 17 were from the waiting group and were excluded because they had started treatment in other places, such as private clinics; 8 subjects changed addresses, and 8 subjects failed to complete the study. Therefore, our analysis was based on 852 observations clustered in 284 subjects (treatment group, 87; waiting group, 101; and school group, 96).
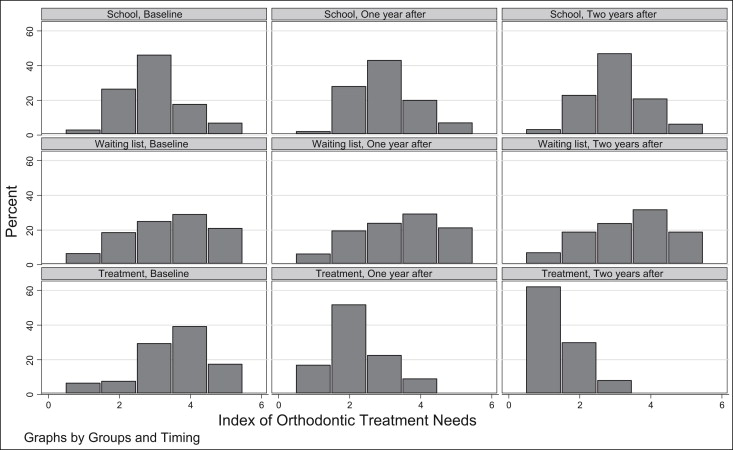
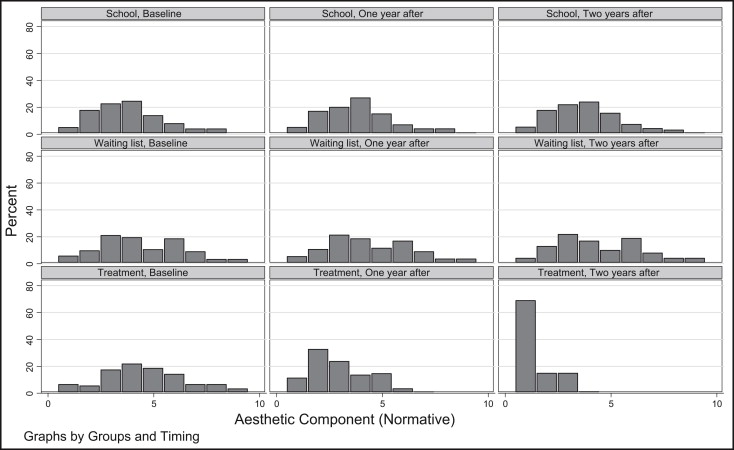
At T2 and T3, important differences were observed in the dental health component, aesthetic component-examiner, and aesthetic component-self scores ( Table II ; Figs 1-3 ). The dental health and aesthetic components scores were significantly reduced by averages of 3.0 and 3.1 points, respectively, in the group that received orthodontic treatment compared with the groups that did not, each of which had no changes. Both differences were statistically significant ( P <0.01). The data distributions are better visualized in the histograms ( Figs 1 and 2 ).
| Groups | Initial (T1) | One year later (T2) | Two years later (T3) | P value ∗ |
|---|---|---|---|---|
| IOTN-AC, self-perceived | ||||
| School (n = 96) | 1.9 | 2.0 | 2.0 | 0.79 |
| Waiting (n = 101) | 3.9 | 4.0 | 4.4 | 0.08 |
| Treatment (n = 87) | 4.1 | 2.8 | 1.3 | <0.01 |
∗ Friedman test for ranking variables with repeated measurements; the P values represent differences between any pair of years of follow-up, not trend.
Stay updated, free dental videos. Join our Telegram channel
VIDEdental - Online dental courses


