Introduction
Mechanical interlocking between a mini-implant (MI) and the bone substrate reflects directly on the primary stability achieved. The purposes of this study were to evaluate MI design performance in distinct bone substrates and correlate geometric characteristics with insertion site quality.
Methods
Two types of self-drilling MIs (1.6 × 8 mm) were allocated to 2 groups according to their geometric designs: Tomas system (Dentaurum, Ispringen, Germany) and Dual-Top (Rocky Mountain Orthodontics, Denver, Colo). Forty sections (8 × 10 mm) were taken from bovine pelvic ilium and pubic bone. Geometric design characteristics were evaluated using scanning electron microscope imaging and Image-Pro Insight software (Media Cybernetics, Rockville, Md). Bone quality parameters were assessed with a microcomputed tomography system, and primary stability was evaluated by insertion torque and pull-out strength. Intergroup comparisons were performed with analysis of variance and Tukey tests, and the Pearson correlation test was carried out ( P <0.05).
Results
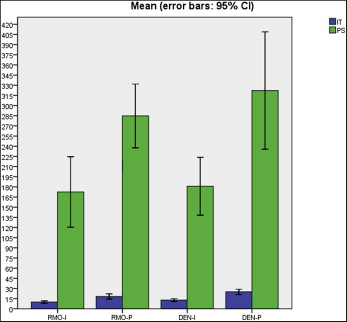
No significant difference was observed in the comparisons of the groups (Tomas: insertion torque, 12.87 N·cm; pull-out strength, 181 N; and Dual-Top: insertion torque, 9.95 N·cm; pull-out strength, 172.5 N) in the ilium. However, the Tomas group had a marked increase in insertion torque (25.08 N·cm; P <0.05) in the pubic bone.
Conclusions
MI mechanical performance differed according to bone quality parameters, indicating that certain geometric parameters may be set depending on the insertion substrate.
Highlights
- •
An evaluation of the correlation between mini-implants design and bone site quality was proposed.
- •
Mini-implants’ mechanical performance was influenced by the insertion site characteristics.
- •
The conical shape, lower surface area, and thread depth were related to mechanical MI performance.
- •
In the lower density bones, both mini-implants designs presented a satisfactory result.
- •
Mini-implants with cylindrical and higher surface area were the most suitable for use in higher density bones.
Because of the challenge of controlling reciprocal tooth movement in noncompliant patients, periodontically compromised patients, and those with a reduced number of teeth undergoing orthodontic treatment, several skeletal anchorage systems have been described in the literature over the past decades. The wide acceptance of the orthodontic mini-implant (MI) as a temporary anchorage device can especially be attributed to minimal anatomic limitations for placement, thus broadening the clinical applications.
Obtaining an efficient interface between MI and bone tissue continues to be the key point to achieving higher success rates. Bone quantity and quality, geometric screw designs, and insertion phase have been well described in the literature as predictors of primary stability. Geometric characteristics of MIs have an impact on the interlocking surface obtained. Since there is considerable variability of bone quality in the same patient, further studies are still necessary to evaluate which type of MI is most suitable for the host bone site available for insertion.
Bone morphometry assessed by microcomputed tomography (micro-CT) is a reliable method to evaluate bone tissue mechanics, and evidence from previous studies has shown that in addition to cortical bone, trabecular bone contributes significantly to the primary stability of MIs. Thus, it is possible to establish the correlation between bone architecture and MI surface properties to enhance the mechanical performance of MIs. The aim of this study was to evaluate the design performance of MIs placed in distinct bone substrates to correlate geometric characteristics with insertion site quality.
Material and methods
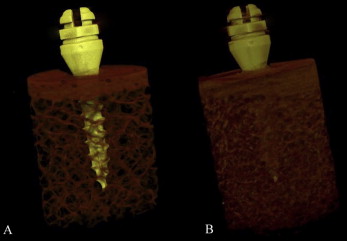
A bovine hip was chosen as the bone model. Ten bovine pelvises ( Bos taurus indicus , Nelore lineage) were obtained from a slaughterhouse immediately after the animals were killed. Twenty sections were taken from the iliac region, lower density bone, and another 20 from the pubic region, higher density bone. Both regions had approximately 1 mm of cortical bone, measured with a caliper gauge (Dentaurum, Ispringen, Germany), and plentiful bone marrow ( Fig 1 ). The sections were removed with a trephine bur (8 × 20 mm long; Sin Implants, São Paulo, Brazil) adapted to a hand piece with a low-speed motor (LB 100; Beltec, Araraquara, Brazil), under irrigation with abundant saline solution. The final sample (8 × 10 mm long) was immersed in saline solution and stored by freezing (–20°C).
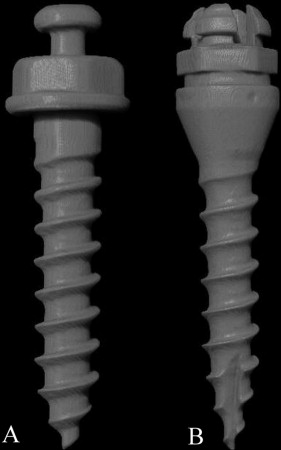
Forty self-drilling MIs (Ti-6Al-4V alloy) (1.6 × 8 mm) were allocated to groups according to their distinct design: Tomas system (Dentaurum [DEN]) and Dual-Top (Rocky Mountain Orthodontics, Denver, Colo [RMO]) ( Fig 2 ). To study the influence of new geometric parameters on primary stability, the available MIs were selected to standardize their diameter and length. The groups (n = 10) were divided on the basis of bone region and MI group: RMO-ilium, RMO-pubic, DEN-ilium, and DEN-pubic. For sample calculation, we worked with data from a previous pilot study (α = 5%; power of study, 80%).
One examiner (A.C.C.) evaluated the MI characteristics, bone quality, and primary stability. The assessments were not blinded. It was possible to visually identify the groups by the bone and the MI characteristics. However, these variables were evaluated objectively, not influenced by the subjectivity of the evaluator.
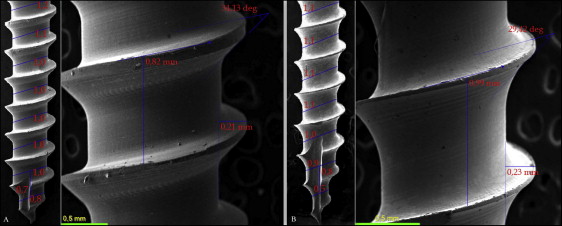
MI photomicrographs (10, 35, 50, and 100 times magnification) were obtained by scanning electron microscope imaging (model JSM-6460LV; JEOL, Peabody, Mass), and the geometric measurements were made using the Image-Pro Insight software program (version 8.0.3; Media Cybernetics, Rockville, Md) ( Table I ). Thread details—angle, depth and pitch—are illustrated in Figure 3 . The thread shape factor was estimated by the relationship between the pitch and depth values, and the degree of conicity was determined by dividing the diameter of 2 shank sections by the pitch. The highest degree of conicity value was considered for each MI group.
| MI | Shape | Diameter (mm) | Length (mm) | Pitch (mm) | Thread | TSF | Conicity (%) | ||
|---|---|---|---|---|---|---|---|---|---|
| Number at 8 mm | Angle (°) | Depth (mm) | |||||||
| RMO | Cylindrical | 1.6 | 8 | 0.82 | 10 | 34.13 | 0.21 | 0.25 | 28 |
| DEN | Conical | 1.6 | 8 | 0.99 | 9 | 29.42 | 0.23 | 0.23 | 50 |
Micro-CT was used to obtain an accurate bone morphometric assessment. Images of the samples were acquired in the micro-CT system (model 1173; Bruker, Kontich, Belgium) with resolution of 14.8 μm, 1-mm thick aluminum filter, 80 kV, 90 μA, and exposure of 800 ms. The samples were kept in 2-mL Eppendorf tubes containing saline solution with the bolt head facing upward. Each 3-dimensional image data set consisted of approximately 800 micro-CT slice images (1.12 × 1.12 pixels) that were reconstructed and evaluated using the NRecon (InstaRecon, Champaign, Ill) and CT-Analyzer software programs (Bruker), respectively. Six bone voxels adjacent to the center (88.8 μm) were excluded from the volume of interest (a cylinder with a 3.6-mm diameter), reducing the influence of metal artifacts on the analyses.
For each image, individual threshold values were determined through histogram analysis by selecting the intermediate gray level value between the 2 peaks of the materials to be distinguished: trabecular bone (white pixels) from the background (empty space, black pixels). Trabecular thickness, trabecular number, and trabecular separation were automatically calculated for cancellous bone. For the total bone block, the trabecular bone volume fraction (bone volume/trabecular volume, BV/TV) was evaluated.
Bone mineral density (BMD) was obtained in grams per cubic centimeter of hydroxyapatite by previously calibrating the software and using an artificial bone block phantom (cortical bone 1-mm thick, 1.64 g/cm³; trabecular bone, 0.32 g/cm³) (Sawbones, Vashon Island, Wash). In both phantoms, an MI of each group was inserted, with the same dimensions, and images were acquired, reconstructed, and analyzed in a manner identical to that used for the regular samples. Total bone block (total BMD), trabecular bone (trabecular BMD), and cortical bone (cortical BMD) densities were obtained.
Two-dimensional images of sagittal and coronal sections were visualized in the DataViewer software program (Bruker) to measure the cortical thickness. Two measurements were taken of each cross-section: one on the left side and other on the right side of the MI. The mean value of these 4 measurements was considered the cortical thickness value (Marquezan et al ). Intraexaminer reliability was assessed in 30% of the samples (measured twice at 1-week intervals) by means of the intraclass correlation coefficient (ICC = 0.98).
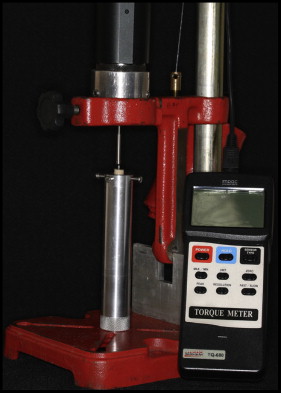
To measure insertion torque, the center of each sample was predrilled with a lance (1.2-mm diameter) (orthodontic kit; INP System, São Paulo, Brazil) to a depth of 1 mm. The samples were inserted with a manual key connected to a digital torque meter (model TQ-8800; Lutron, Taipei, Taiwan) until the first thread at the top (immediately after the end of the collar profile) was fully contained in the block to guarantee that all thread length was inserted. A mechanical device was used to align the torque meter, the MI, and the bone blocks, maintaining the system in a perpendicular relationship ( Fig 4 ). The peak insertion torque values were recorded in newton centimeters (N·cm).
The pull-out strength test was conducted in a universal testing machine (model DL 2000; Emic, São José dos Pinhais, Brazil) connected to a 500-Kgf load cell. To maintain an exact axial coincidence of the system, 2 stainless steel devices were specially developed. A crosshead speed of 5 mm per minute was selected, based on the American Standard Specification and Test Methods F543-07 guidelines for surgical metal bone screws, and the maximum pull-out strength was registered in newtons (N).
Statistical analysis
Statistical analysis was performed with the SPSS software program (version 18; SPSS, Chicago, Ill). Normality and homogeneity were verified with the Shapiro-Wilk and Levene tests. Once the normal distribution and homogeneity of the results had been certified, analysis of variance and Tukey tests were used for intergroup comparisons. The Pearson correlation test was applied to verify the correlational relationships between primary stability and geometric parameters. The level of significance was 5%.
Results
The results of intergroup comparisons for bone quality and primary stability are given in Tables II and III and Figure 5 . The mechanical performance of the MIs was clearly influenced by bone quality, since higher insertion torque and pull-out strength values were found in the pubic bone substrate ( P <0.05).
| Group | Ct.Th (mm) | Ct.BMD (g/cm³) | BV/TV (%) | Total BMD (g/cm³) |
|---|---|---|---|---|
| RMO-I | 0.81 (±0.49) a | 1.41 (±0.08) a | 20.74 (±1.34) a | 0.46 (±0.02) a |
| RMO-P | 1.09 (±0.07) b | 1.62 (±0.09) a | 30.63 (±2.44) b | 0.66 (±0.04) b |
| DEN-I | 0.96 (±0.06) ab | 1.31 (±0.05) a | 19.06 (±1.38) a | 0.40 (±0.02) a |
| DEN-P | 1.11 (±0.07) b | 1.58 (±0.09) a | 33.70 (±1.63) b | 0.67 (±0.03) b |
| Group | Tb.BMD (g/cm³) | Tb.N (mm −1 ) | Tb.Sp (mm) | Tb.Th (mm) |
|---|---|---|---|---|
| RMO-I | 0.36 (±0.02) a | 0.93 (±0.02) a | 0.62 (±0.01) b | 0.15 (±0.00) a |
| RMO-P | 0.53 (±0.03) b | 1.37 (±0.06) b | 0.51 (±0.01) a | 0.16 (±0.01) a |
| DEN-I | 0.32 (±0.02) a | 0.85 (±0.06) a | 0.67 (±0.02) b | 0.15 (±0.00) a |
| DEN-P | 0.54 (±0.02) b | 1.45 (±0.04) b | 0.51 (±0.01) a | 0.17 (±0.00) a |