Introduction
There is a paucity of information with regard to the susceptibility of iatrogenic white spot lesion formation after inattentive, surplus orthodontic etching with 30% phosphoric acid and the subsequent provision or absence of adequate oral hygiene.
Methods
Ninety sound enamel specimens were randomly allocated to 6 trial groups (n = 15 each) for etching with 30% phosphoric acid for either 15 seconds and standardized daily enamel brushing or no brushing, etching for 30 seconds with daily brushing or no brushing, or nonetched controls with brushing or no brushing. Nutritive acidic assaults were simulated by demineralization cycles 3 times per day for 1 hour with interim storage in artificial saliva. Lesion depths in terms of percentage of fluorescence loss (delta F, delta Q) and lesion extension compared with the baseline were assessed by using quantitative light-induced fluorescence after 2, 7, 14, 21, and 42 days. Etching duration, trial time elapse, and oral hygiene, as well as the significance of factor interactions, were analyzed with 3-way analysis of variance (α = 5%).
Results
The impact of the factors of enamel brushing, trial time elapse, and etching each had a comparably significant effect on lesion progression. The effect of surplus etching on white spot lesion formation was significantly enhanced by the simultaneous absence of enamel brushing and also the progression of trial time. The combination of 30 seconds of surplus etching with inadequate oral hygiene was especially detrimental.
Conclusions
Excessive surplus orthodontic etching of the complete labial enamel surface, instead of the bracket bases only, must be avoided to prevent iatrogenic white spot lesions. Etching times not exceeding 15 seconds are favorable.
The use of fixed orthodontic appliances and the conditioning of enamel surfaces by etching with phosphoric acid to achieve microretention for bonding brackets with composite adhesive systems are common components of fixed orthodontic therapy. Although the benefits of contemporary orthodontics are inconceivable without multi-bracket appliances, there is also a downside: poor oral hygiene is known to cause white spot lesions within weeks. Preventive strategies reported in the literature have focused on the application of fluoride-releasing varnishes, fluoride-releasing bonding materials, chlorhexidine for lowering the level of Mutans streptococci, and high concentrations of fluoride gels, or daily rinsing to prevent enamel demineralization.
White spot lesions are not only disturbing esthetically, especially in the anterior teeth, but also are an initial stage of enamel caries, producing outer enamel layers with significantly reduced mineralization that will progress to a stage at which restoration will be needed, if inadequate oral hygiene prevails.
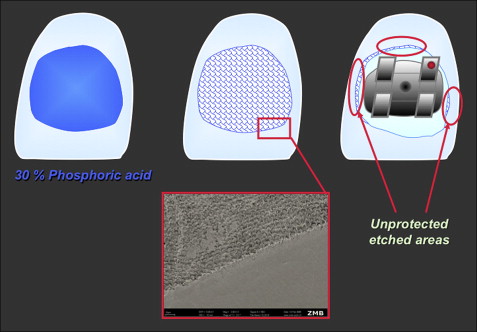
Previous experiments on bovine enamel, including extensive etching intervals, suggested that white spot lesions might be triggered iatrogenically under some circumstances: eg, by surplus etching of enamel areas that are subsequently not covered by bracket bases or bonding material, because etching removes parts of the outer enamel layer and results in a rough, retentive surface ( Fig 1 ). This can be especially severe in teeth in which almost the complete facial enamel surface is etched but subsequently incompletely covered by bonding material or sealers. There is a lack of information in the literature regarding the question of whether these areas show increased susceptibility to white spot formation and whether demineralization of these possible predilection sites is enhanced by oral hygiene measures, etching duration, and observation time.
This study was designed to evaluate the effect of enamel conditioning with 30% phosphoric acid for either 15 or 30 seconds with and without careful enamel brushing (oral hygiene) on the formation of cariogenic white spot lesions in a period of 6 weeks after etching and bonding by using quantitative light-induced fluorescence.
The null hypotheses were no significant differences in terms of demineralization depth and lesion extension compared with the baseline between a nonetched control group and (1) phosphoric acid enamel conditioning with either 15 or 30 seconds, and (2) subsequent adequate or inadequate oral hygiene at 2, 7, 14, 21, and 42 days after treatment.
Material and methods
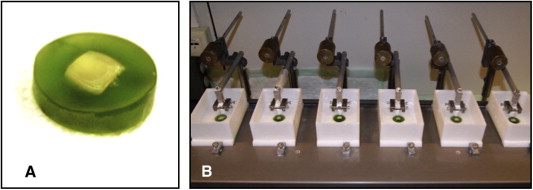
Enamel specimens were obtained from the labial surfaces of 90 permanent anterior teeth selected by using the exclusion criteria of decay, demineralization, or restorations ( Fig 2 , A ). The teeth were stored in isotonic sodium chloride solution with 0.1% thymol before the trial to prevent desiccation and demineralization. For the trial, the specimens were mounted on acrylic base plates (Technovit 4071; Heraeus Kulzer, Wehrheim, Germany) and slightly polished to a graining grade of 1200 (Struers, Erkrath, Germany) for standardization of enamel surfaces in terms of evenness and plane-parallel orientation during analysis. The enamel area to be measured had a diameter of 5 mm and was determined and automatically retrieved at the follow-up assessments with system-immanent quantitative light-induced fluorescence software.
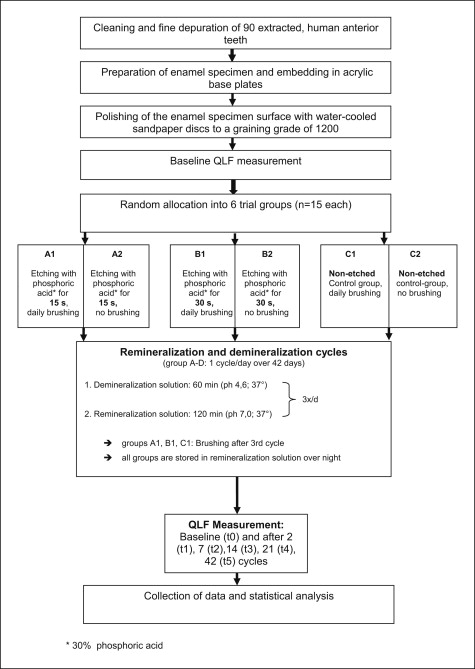
Specimens fulfilling the selection criteria were randomly allocated to 6 trial groups (n = 15 each) for etching with 30% phosphoric acid for either 15 seconds and once a day brushing (A1) or no brushing (A2), or etching for 30 seconds with daily brushing (B1) or no daily brushing (B2), and nontreated controls with brushing (C1) or no brushing (C2) ( Fig 3 ).
An objective method used for detecting white spot lesion formation and scoring the progress of enamel demineralization is to measure lesion depth in terms of percentages of fluorescence loss over time compared with the baseline by using quantitative light-induced fluorescence because enamel auto-fluorescence is directly related to the mineral content of the enamel, allowing for repeated, nondestructive, noninvasive measurements. A lowered fluorescence (by negative delta F values) indicates progress in demineralization.
In this study, demineralization was measured with 3 parameters: lesion depth expressed as a percentage of fluorescence loss compared with the baseline (delta F), lesion extension expressed as the area of demineralization (mm ), and delta Q values (defined as fluorescence radiance loss integrated over the lesion area [mm 2 · %]) compared with the baseline assessed by quantitative light-induced fluorescence (Inspektor Research Systems, Amsterdam, The Netherlands) and corresponding quantitative light-induced fluorescence software (version 2.0.0.43, Inspektor Pro Software, Inspektor Research Systems) at baseline and after 2, 7, 14, 21, and 42 days. The calculation of delta Q values compensated for minor fluctuations in measurement, since they were being leveled by putting fluorescence values in relation to the assessment of the area of demineralization.
The accuracy and reproducibility of the quantitative light-induced fluorescence results were ensured by excluding day and ambient light, and by an automatic calibration process implemented before each measurement cycle.
The experimental setup is illustrated in Figure 3 . All quantitative light-induced fluorescence assessments were performed by 1 operator (M.B.).
Nutritive acidic assaults were simulated by demineralization cycles 3 times per day, each lasting 60 minutes, by using a demineralization solution that had previously been demonstrated to be suitable for causing white spot lesions ( Table I ). Between the demineralization cycles, the enamel specimens were stored in an artificial saliva and remineralization solution for 120 minutes. Therefore, a complete 1-day demineralization-remineralization program consisted of 3 hours of demineralization and 6 hours of remineralization, with subsequent overnight storage in the remineralization solution. Brushing in groups A1 through C1 was carried out each day after completion of all demineralization and remineralization cycles by using a brushing machine with commercially available toothbrushes (Dr. Best Flex Plus Medium; GlaxoSmithKline, Bühl, Germany) at a constant pressure of 2.5 N with a 1:3 slurry of artificial saliva and fluoridated dentifrice (Elmex; GABA, Lörrach, Germany) with subsequent water rinsing ( Fig 2 , B ). Figure 3 provides the flow chart for the trial and the ingredients, and the mode of application of the demineralization and remineralization solutions is shown in Table I .
| Product | Application | Contents |
|---|---|---|
| Demineralization solution at 37°C | 30 mL/specimen | 2.0 mmol/L Ca(NO 3 ) 2 × 4H 2 O, 2.0 mmol/L NaH 2 PO 4 × 2H 2 O, 0.075 mmol/L acetate buffer, 0.02 ppm NaF, pH = 4.7 |
| Remineralization solution at 37°C (Roth, Karlsruhe, Germany) | Storage solution/between demineralization cycles | 1.5 mmol/L Ca(NO 3 ) 2 × 4H 2 O, 0.9 mmol/L NaH 2 PO 4 × 2H 2 O, 150 mmol/L KCL, 0.1 mol/L Trispuffer, 0.03 ppm NaF, pH = 7.0 |
| Artificial saliva (remineralization) solution according to Klimek et al (Merck, Darmstadt, Germany) | Brushing slurry: artificial saliva vs dentifrice 1:3 | Ascorbic acid 0.011 mmol/L, glucose 0.2 mmol/L, NaCl 9.9 mmol/L, CaCl 2 × 2H 2 O 1.5 mmol/L, NH 4 Cl 3.0 mmol/L, KCL 17.0 mmol/L, NaSCN 2.0 mmol/L, KH 2 PO 4 2.4 mmol/L, carbamide 3.3 mmol/L, Na 2 HPO 4 2.4 mmol/L, mucine 2.7 g/L, Aqua Destillata 1000 mL |
Statistical analysis
The influence of the individual experimental factors—oral hygiene with enamel brushing, duration of etching, and trial time—as well as the interactions between those factors, on delta F, delta Q, and demineralization area extension values were analyzed both descriptively with mean values and standard deviations, and by using 3-way analysis of variance (ANOVA) for longitudinal data. In this mixed model, time was modeled as a repeated-measures factor. In the case of significant interactions between the experimental factors, the data were split and further analyzed by using 2-way ANOVA. The significance level was set to 5%. All analyses were performed with the software R (version 2.12; www.r-project.org ).
Results
For all 3 assessment parameters—fluorescence loss, extension of demineralized enamel area, and delta Q—there were no changes in the daily brushed, nonetched control group C1. However, omitting daily brushing did have a demineralizing effect on the nonetched controls ( Tables II and III ; Figs 4-6 ). The results of the ANOVA for fluorescence (delta F) values ( Table II ) show that the impact of the factors of enamel brushing, trial time elapse, and etching all have comparably significant influences.
| Brushing | Duration of etching (s) | Time elapsed (days from baseline) | Fluorescence (delta F) | Area of demineralization (mm 2 ) | Delta Q |
|---|---|---|---|---|---|
| No | 0 | 2 | 0.00 ± 0.00 | 0.00 ± 0.00 | 0.00 ± 0.00 |
| 7 | −1.78 ± 3.09 | −0.01 ± 0.02 | 0.07 ± 0.16 | ||
| 14 | −0.45 ± 1.73 | 0.00 ± 0.00 | 0.00 ± 0.02 | ||
| 21 | −0.84 ± 2.14 | −0.01 ± 0.02 | 0.01 ± 0.02 | ||
| 42 | −1.60 ± 2.75 | −0.01 ± 0.01 | 0.04 ± 0.07 | ||
| 15 | 2 | −0.77 ± 2.04 | 0.00 ± 0.00 | 0.01 ± 0.02 | |
| 7 | −0.41 ± 1.58 | 0.00 ± 0.00 | 0.00 ± 0.02 | ||
| 14 | −0.38 ± 1.47 | 0.00 ± 0.01 | 0.01 ± 0.03 | ||
| 21 | 0.00 ± 0.00 | 0.00 ± 0.00 | 0.00 ± 0.00 | ||
| 42 | −1.75 ± 3.03 | −0.02 ± 0.05 | 0.11 ± 0.36 | ||
| 30 | 2 | −0.91 ± 2.39 | −0.02 ± 0.06 | 0.11 ± 0.38 | |
| 7 | −3.27 ± 3.43 | −0.07 ± 0.10 | 0.44 ± 0.65 | ||
| 14 | −2.01 ± 2.94 | −0.01 ± 0.02 | 0.06 ± 0.10 | ||
| 21 | −2.50 ± 3.19 | −0.01 ± 0.02 | 0.05 ± 0.10 | ||
| 42 | −2.70 ± 3.46 | −0.04 ± 0.10 | 0.32 ± 0.74 | ||
| Yes | 0 | 2 | 0.00 ± 0.00 | 0.00 ± 0.00 | 0.00 ± 0.00 |
| 7 | 0.00 ± 0.00 | 0.00 ± 0.00 | 0.00 ± 0.00 | ||
| 14 | 0.00 ± 0.00 | 0.00 ± 0.00 | 0.00 ± 0.00 | ||
| 21 | 0.00 ± 0.00 | 0.00 ± 0.00 | 0.00 ± 0.00 | ||
| 42 | 0.00 ± 0.00 | 0.00 ± 0.00 | 0.00 ± 0.00 | ||
| 15 | 2 | −1.27 ± 2.63 | −0.01 ± 0.03 | 0.06 ± 0.17 | |
| 7 | −2.08 ± 3.05 | −0.02 ± 0.04 | 0.12 ± 0.22 | ||
| 14 | −0.78 ± 2.06 | 0.00 ± 0.01 | 0.02 ± 0.05 | ||
| 21 | −0.78 ± 2.05 | −0.02 ± 0.07 | 0.11 ± 0.43 | ||
| 42 | − 1.62 ± 2.79 | − 0.01 ± 0.03 | 0.06 ± 0.19 | ||
| 30 | 2 | 0.00 ± 0.00 | 0.00 ± 0.00 | 0.00 ± 0.00 | |
| 7 | − 0.50 ± 1.94 | 0.00 ± 0.01 | 0.01 ± 0.04 | ||
| 14 | 0.00 ± 0.00 | 0.00 ± 0.00 | 0.00 ± 0.00 | ||
| 21 | − 0.42 ± 1.61 | 0.00 ± 0.00 | 0.00 ± 0.02 | ||
| 42 | − 1.89 ± 3.27 | − 0.04 ± 0.08 | 0.27 ± 0.60 |
| Effect | P (delta F) | P (area of demineralization) | P (delta Q) |
|---|---|---|---|
| Brushing | <0.01 | 0.08 | 0.13 |
| Etching duration | <0.01 | <0.01 | <0.01 |
| Trial time elapse | <0.01 | 0.06 | 0.02 |
| Brushing × etching | 0.13 | 0.04 | 0.07 |
| Brushing × time | 0.50 | 0.62 | 0.77 |
| Etching × time | 0.22 | 0.12 | 0.04 |
| Brushing × etching × time | 0.23 | 0.15 | 0.26 |
Stay updated, free dental videos. Join our Telegram channel
VIDEdental - Online dental courses


