Introduction
The aim of this controlled study was to analyze the degree and localization of 3-dimensional (3D) facial asymmetry in adult patients with cleft lip and palate (CLP) compared with a control group and its impact on the visual perception of faces.
Methods
The degree of 3D asymmetry was analyzed with a novel method without landmarks in 18 adults with complete unilateral CLP and 18 adults without congenital anomalies. Furthermore, the CLP and control faces were rated for appearance, symmetry, and facial expression by 30 participants.
Results
The results showed that adults with CLP had significantly greater asymmetry in their facial soft tissues compared with the control group. Moreover, the lower face, and particularly the midface, had greater asymmetry in the CLP patients. The perceptual ratings showed that adults with CLP were judged much more negatively than those in the control group.
Conclusions
With sophisticated 3D analysis, the real morphology of a face can be calculated and asymmetric regions precisely identified. The greatest asymmetry in CLP patients is in the midface. These results underline the importance of symmetry in the perception of faces. In general, the greater the facial asymmetry near the midline of the face, the more negative the evaluation of the face in direct face-to-face interactions.
Despite the speed with which we make decisions about attractiveness, the process of judging facial appearance is complex. Several interacting factors that determine how attractive faces are perceived are discussed in the literature. In addition to facial expressions and secondary sexual characteristics, symmetry is considered a main factor in the visual perception of faces. It has been reported for several species, including humans, that symmetrical body shape is a central cue for attractiveness.
This fact allows the assumption of a potential disadvantage in the visual perception of patients with cleft lip and palate (CLP). Although the face of a patient with CLP clearly appears more symmetrical after surgery, even the most advanced interventions do not result in a completely normal facial appearance. Even when surgery was completed early in infancy and followed by comprehensive therapeutic rehabilitation, asymmetry around the nose and upper lip appears to characterize the facial appearance in CLP patients. This slight but visible asymmetry might evoke interference in visual perception.
To capture facial asymmetry, a 3D imaging technique is required for correct analysis. Various methods have been developed for acquisition of these data. In radiologic image capturing, 3D computed tomography has gained considerable popularity and is used in various orthodontic and surgical analyses, but, with regard to facial analysis in orthodontics, the exposure to a high dose of ionizing radiation allows no standardized use.
For analysis of soft-tissue asymmetries, the routine diagnosis is still based on the analysis of patients’ facial photographs. This 2-dimensional method analyzes asymmetries by determining a symmetry plane and measuring linear and planar differences between hemifaces. The landmarks used to determine the midline of the face—nose, philtrum, and chin—are often not exactly in the midline of the face; this calls into question the precision of the symmetry-plane measurement. Even in patients with CLP, nasal morphology has been reported to be more asymmetric than that of the controls. Therefore, the measurements of facial soft tissues should be conducted with a noninvasive and landmark-independent 3D method.
Noninvasive soft-tissue data have been reported in several studies of the facial surface in CLP patients. Unfortunately, only a few studies have quantified facial asymmetry in adults with CLP. Moreover, the analysis of asymmetry was confined to a few landmarks, not taking advantage of all points on the facial surface. Thus a 3D noncontact technique must be proven for quantification of facial analysis.
Several studies have assessed how various techniques for 3D reconstruction such as laser scanning, holography, and stereophotogrammetry quantify the 3D facial asymmetry of soft tissues. Stereophotogrammetry is based on converging images to build up a 3D model that can be viewed from any perspective and measured from any direction to provide a more comprehensive and accurate evaluation of the object. This provides information about the 3D coordinates of any facial landmark, so that linear, angular, and volumetric measurements can be calculated to detect changes in facial morphology. This technique has been used to study facial asymmetry in patients who had orthognathic treatments and CLP. The approach was to identify an objective indicator of facial asymmetry by using various mathematical methods.
The aim of this prospective controlled study was to analyze the following with a novel 3D landmark-independent method developed by Benz et al : (1) the degree of the facial asymmetry in adults with CLP compared with a control group without congenital anomalies, (2) the localization and shape of the asymmetric regions in each face of the 2 groups, and (3) the visual impact of 3D asymmetry on the perception of facial appearance, symmetry, and expreession.
Material and methods
All patients were treated at the Department of Orthodontics of the University of Wuerzburg in Germany. All were white, and 2 groups were assembled.
Group I (CLP) included 18 adults (9 women, 9 men) aged 17 to 35 years (mean, 21.6 years) with complete unilateral CLP (uCLP) (with no other associated malformations or distinctive features in the face such as piercing or tattoos); they were randomly selected. Four patients (1 woman, 3 men) had a uCLP on the right side; the other 14 (8 women, 6 men) had a uCLP on the left side. All patients were operated on by the same team of maxillofacial surgeons. Primary closure of the lip was conducted according to the methods of Tennison and Randall between the sixth and ninth months of age. No primary rhinoplasty was performed. Closure of the hard and soft palates was done at 12 to 18 months of age. All patients underwent preoperative infant orthopedic treatment by wearing an acrylic plate shortly after birth until palatal closure. Twelve patients received a secondary alveolar bone graft between ages 10 and 13 years. During eruption of the permanent teeth, interceptive orthodontic treatment was started to prevent transverse collapse of the dental arch and to control and develop maxillofacial growth. In all patients, a fixed orthodontic appliance was placed afterward to align the permanent teeth. At the end of facial growth, 1 boy had correction of the lip and nose, and 1 girl had correction of the nose. Orthognathic surgery was performed in 4 patients (2 women, 2 men).
Group II (control) included 18 skeletal Class I, sex-matched adults of the same ethnicity, aged 22 to 30 years (mean, 25.5 years), randomly selected as the control group. These subjects were treated for various types of malocclusions, but none had surgical treatment. None had distinctive features in the face such as piercing or tattoos.
For the picture-rating task, 30 volunteers (mean age, 26.8 years; 15 women, 15 men) were chosen. The raters were recruited from newspaper announcements. Volunteers who worked in health care services or had a congenital or other noticeable anomaly in their face were excluded from the study.
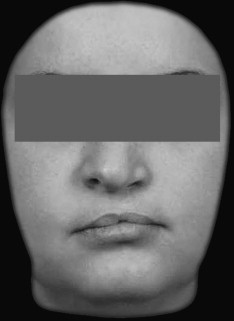
Black and white pictures of the faces were taken of all patients in the 2 groups for rating. All photos were taken with a neutral facial expression and eyes looking straight ahead ( Fig 1 ). All pictures were taken with the same dark background and masked with Photoshop (version 7.0, Adobe, San Jose, Calif) under the chin and around the head, so that ears, hair, and other peripheral features were eliminated. The picture size was set to 412 × 581 pixels with a resolution of 96 pixels per inch.
For presentation of the pictures, the raters were seated comfortably 50 cm in front of a 17-in monitor (resolution 1024 × 768). The presentation of the pictures was controlled by the software Presentation (version 0.90, Neurobehavioral System, Albany, Calif).
All 36 pictures of the faces were presented separately in random order on the monitor. To prevent any bias between the right and left sides, all faces were shown twice, once in the original direction and once mirrored. This resulted in a set of 72 faces to rate. All participants rated each face separately on a 9-point-scale 3 times for 3 conditions: appearance (1, very bad appearance; 9, very good appearance), symmetry (1, very asymmetric; 9, very symmetric), and facial expression (1, very negative; 9, very positive).
Each condition was rated in random order, so that a total of 216 pictures were rated by each participant. The presentation time for each face was defined by the participants themselves. For the picture-rating task, the mean rate and the standard error of the mean were used for each condition.
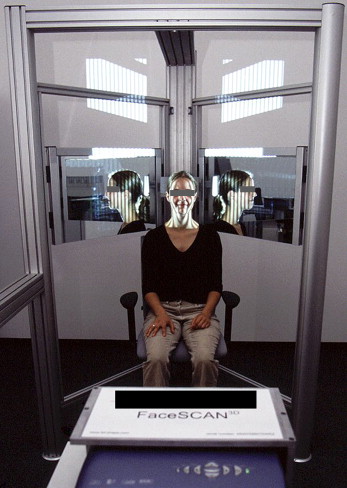
The FaceScan optical 3D sensor (3D-Shape GmbH, Erlangen, Germany) was used for data acquisition of the patients’ facial surfaces. The sensor is based on a phase-measuring triangulation method (accuracy in z-direction is 0.2 mm, with a measurement time of 0.3 seconds. There was no need for special safety precautions to protect the patient because the light intensity was low. A mirror construction especially designed for orthodontic purposes allowed the patient’s face to be captured from ear to ear in 1 recording ( Fig 2 ). The software Slim3D (3D-Shape) was used for triangulation, merging, and postprocessing the 3D data. The final 3D output was a triangulated polygon mesh.
For analyzing the facial asymmetry of the patients’ 3D data, it was first necessary to determine the symmetry plane of the face. The method of Benz et al was used for this. Their approach was to base the determination of the symmetry plane on a registration problem, whereas the symmetry’s plane position could be determined by superimposing the original 3D data onto its mirror image obtained by a reflection along an initially arbitrary plane. Hence, the symmetry plane is characterized by the registration between the original face’s spatial arrangement and its mirror image.
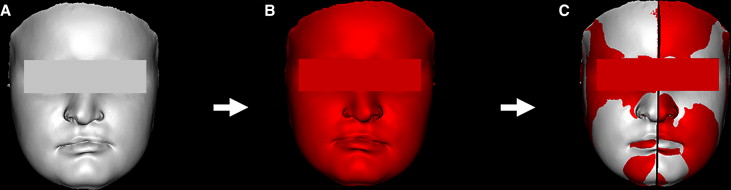
The method used is illustrated in Figure 3 . First, the triangulated polygon meshes of the original faces were mirrored. Then the original and mirror images were registered with a rough registration followed by a fine registration to superimpose the original and the mirror images more precisely. For each point of the original data set, the closest point in the superimposed mirror data set was determined. Thus, the distance of the 2 data sets was reduced to a minimum. A detailed description of the algorithm for the registration procedure can be found in the literature. After the fine registration, the symmetry plane was determined from correlating points of the original and mirror images.
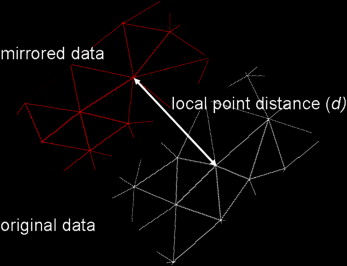
Subsequently, for computing facial asymmetry, the distance between the original image and its mirrored image was measured by quantitative analysis. Therefore, the local point distances for every triangle of the 3D data to the corresponding triangle in the superimposed images were analyzed. Figure 4 shows the computing for 1 local point distance for 1 corresponding triangle. The basic algorithm was described by Benz et al. The mean absolute distances were calculated from all local point distances between the original and the mirror images. The greater the face’s asymmetry, the greater the mean absolute distance (Dabs). Therefore, the Dabs was defined as the index of facial asymmetry.
The maximum index of asymmetry was calculated in the control group to furnish a threshold value for the definition of asymmetry as suggested by Farkas.
The high reliability and validity for computing the facial symmetry plane and the degree of asymmetry were shown in previous studies.
In addition to the analysis of the asymmetry of the entire face, the face was divided into 2 parts to investigate the asymmetry separately for each part: midface (nasion to subnasale) and lower face (subnasale to gnathion).
For each part of the face, the Dabs (index of facial asymmetry) was calculated from all local distances between the original and the mirror images.
To estimate the method error, the 3D data of 10 randomly selected patients and 10 randomly selected controls were analyzed a second time 6 weeks later. The method error was calculated according to Dahlberg’s formula. A repeated-measures t test was performed to assess the systematic error.
Statistical analysis
SPSS software (version 14.0, SPSS, Chicago, Ill) was used for the statistical analyses. The t test for paired groups was used to assess differences between both groups in facial asymmetry and to analyze the rating task. A stepwise multiple linear regression analysis was performed for all patients to determine whether the asymmetric degree of the entire face, the midface, or the lower face plays a role in prediction for appearance, symmetry, and facial expression. The levels of significance were set at P <0.05 and P <0.001.
Results
In all patients, the acquisition of the 3D data and the objective calculation of the facial asymmetry were successful. The repeated measures t test yielded no significant results, indicating no relevant systematic error.
Analysis of the method error showed no significant difference between the first and second measurements of 3D asymmetry. The measurement error was less than 0.006 mm. Thus, good reproducibility could be shown for each parameter.
The quantitative analyses of facial asymmetry in CLP patients compared with the control group are shown in the Table . The Dabs as the index of facial asymmetry is given for the entire face as well as for the midface and the lower face.
| CLP patients (n = 18) |
Control subjects (n = 18) |
||||
|---|---|---|---|---|---|
| Index of asymmetry |
Mean Dabs (mm) |
SD | Mean Dabs (mm) |
SD | P value |
| Entire face | 0.87 | 0.26 | 0.59 | 0.11 | 0.001 ∗ |
| Midface | 1.15 | 0.44 | 0.65 | 0.14 | <0.001 † |
| Lower face | 0.79 | 0.23 | 0.59 | 0.13 | <0.001 † |
Stay updated, free dental videos. Join our Telegram channel
VIDEdental - Online dental courses


