Introduction
The purpose of this study was to determine how the amount of surgical insult affects the quantity and maturity of dentoalveolar bone around teeth that have been orthodontically moved.
Methods
A split-mouth design with 8 foxhound dogs was used to evaluate bone surrounding maxillary second premolars that were protracted for 15 days and retained for 7 weeks. The maxillary first premolars were extracted, and the interseptal bone was removed to within 1 mm of the second premolars; on the insult (lesser surgical insult) side, buccal and lingual vertical grooves were made in the extraction socket to undermine the mesial root of the second premolar; the insult+ (greater surgical insult) side was flapped and had modified corticotomies extending to, but not through, the lingual cortex 1 mm distal to the distal root, and 3 to 5 mm apical to both roots. Microcomputed tomography analyses were used to evaluate the material density, bone volume fraction, and trabecular characteristics of surrounding bone. Hematoxylin and eosin sections were used to determine osteoclast numbers, bone surface areas, and bone volumes.
Results
After 7 weeks of consolidation, there was significantly ( P <0.05) less bone on the insult+ side; it was less dense and less mature than the bone on the insult side. Relative to the control bone, bone on the insult+ side was significantly less dense but showed no differences in bone volume. Preliminary histologic evaluations indicated increased numbers of osteoclasts and greater bone surface areas on the insult+ side than the insult side, but no differences in bone volume.
Conclusions
Increased surgical insults produce less dense and less mature bone but have no effect on bone volume at 9 weeks after surgery.
Studies evaluating orthodontic treatment duration indicate that the average patient requires 23.5 to 28.6 months to complete treatment. Altering the biology of bone to enhance tooth movement is appealing because it could dramatically improve treatment efficiency. In addition to fewer appointments, more efficient treatment might prevent the patient from experiencing negative sequelae secondary to orthodontic treatment, such as external apical root resorption and enamel decalcification.
Conventional tooth movement is a biologic rate-limiting process that depends on the ability of the periodontal ligament to respond to the strains induced by orthodontic forces and mediate the repair of bone. Under normal conditions, cells of the periodontal ligament secrete osteoprotegerin to inhibit osteoclast formation and maintain the integrity of the periodontal ligament. Upon force application, the bone becomes strained, cell membranes disrupt, and a biochemical cascade of events occurs, stimulating osteoclastogenesis and bone formation. As the bone adapts to the strain by simultaneous resorption and formation, tooth movement occurs. Based on the clinical research, force levels of 60 to 300 g produce average tooth movement rates of approximately 1 mm per month in humans.
Tooth movements can be accelerated by altering bone biology. After a noxious stimulus (ie, bone injury or operation), acceleration of most ongoing normal hard-tissue and soft-tissue processes occurs, including increased bone metabolism, turnover, and modeling. This complex reaction, known as the regional acceleratory phenomenon, initiates the healing process of the injured tissue, resulting in a temporary decrease in regional bone density and an increase in remodeling. The use of corticotomies to produce the regional acceleratory phenomenon and facilitate orthodontic treatment dates back to the late 1950s, but corticotomies were not used clinically to enhance treatment outcomes until the late 1980s and early 1990s. Wilcko et al popularized this approach to accelerate orthodontic tooth movement rates. Since then, corticotomies have been used to facilitate the intrusion, distalization, and extrusion of teeth.
Experimental studies have demonstrated positive effects of corticotomies on tooth movements. Cho et al reported 2 to 4 times greater experimental than control tooth movements in beagle dogs. Others have shown greater experimental tooth movements as early as the first week but not after the fourth week. Longitudinal models have demonstrated that experimental tooth movements in the mandibles of dogs peak after the third week, when they were moving 85% faster than the control teeth. These studies indicate that there is a relatively small window of opportunity to take advantage of the regional acceleratory phenomenon.
Importantly, the effects of the regional acceleratory phenomenon on tooth movements are not all or nothing. Sanjideh et al demonstrated that an additional corticotomy procedure, initiated 4 weeks after the first surgical insult, produced significantly greater tooth movements than 1 initial corticotomy. Increased amounts of injury around multirooted teeth also cause increased tooth movements, with the maxillary second premolars protracted 1.8 and 2.9 mm on the limited and extensive surgical insult sides, respectively.
Although increased surgical insults are related to increased tooth movements, it remains unknown how different amounts of surgical insult affect the bone around treated teeth. The purpose of this study was to evaluate the dentoalveolar bone subjected to heavy orthodontic forces and differing amounts of surgical insult. The null hypothesis was that there are no differences in the quantity and maturity of dentoalveolar bone between 2 treatments producing differing amounts of surgical insult.
Material and methods
Eight skeletally mature (1-2 years of age) male foxhound dogs, weighing 25 to 30 kg, were used for this study. The surgical and orthodontic procedures were fully described by Cohen et al, who evaluated their tooth movements. Before the surgeries, the maxillary right and left first premolars were extracted. The extraction sites were extended distally to within 1 mm of the second premolars (to simulate the width of human interseptal bone). The maxillary quadrants were randomly assigned to 1 of 2 groups, insult or insult+, signifying the level of insult to the alveolar bone surrounding the second premolar.
On the insult side, the investigators undermined the interseptal bone mesial to the second premolars by making vertical grooves in the extraction socket along the buccal and lingual sides, extending the cuts obliquely toward the base of the interseptal bone to weaken its resistance and stimulate the regional acceleratory phenomenon ( Fig 1 ). On the insult+ side, a full-thickness gingival flap was raised, and the buccal plate between the second premolar and the canine was removed, along with any possible interference to translation of the tooth and bony segment. A vertical osteotomy extending to, but not through, the lingual cortex was performed 1 mm distal to the second premolar. The vertical osteotomy and extraction sites were then connected by a horizontal corticotomy 1 to 2 mm deep and 3 to 5 mm apical to the second premolar ( Fig 1 ).
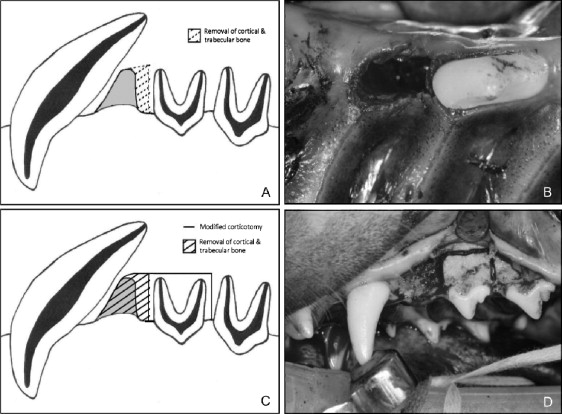
Immediately after surgery, custom orthodontic appliances, consisting of bands soldered to a hyrax screw (opened to allow protraction of the maxillary second premolar upon activation), were cemented in place. Protraction of the maxillary second premolars was initiated at a rate of .5 mm per day (2 closing turns of the hyrax screw) for 15 days. After protraction, the second premolars were retained by the appliance over a 7-week consolidation period, after which the experimental animals were sacrificed. The maxillas were then sectioned and removed from the skulls and stored in 70% ethanol.
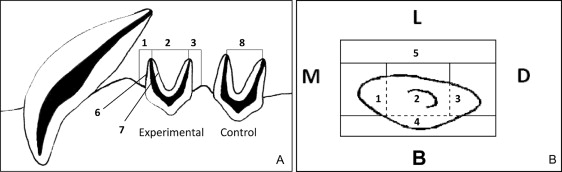
Insult, insult+, and control bone specimens were harvested from each dog. Seven regions of interest were evaluated on the insult and insult+ sides, including the (1) mesial trabecular, (2) interradicular trabecular, (3) distal trabecular, (4) buccal cortical, and (5) lingual cortical bones, as well as the cortical (bundle) bone along the (6) mesial and (7) distal root surfaces of the mesial root ( Fig 2 ). An eighth region of interest, located in the interradicular trabecular bone of the maxillary third premolar, served as the untreated control bone.
Bone quantity was based on the material density (the amount of bone mass per unit of volume, minus any voids) and the percent of bone volume (ratio of the number of bone voxels to the total number of voxels in a specific region of interest). Bone maturity was measured based on trabecular number, trabecular thickness, and trabecular separation.
The heights of the specimens from the most occlusal aspect of the experimental crown to within 5 mm of bone apical to the root apices were approximately 30 mm. The specimens were trimmed to fit in 30-mm-diameter tubes, using foam to stabilize their positions; 70% ethanol was poured over the specimens, and the tubes were covered with Parafilm (Pechiney Plastic Packaging, Chicago, Ill) to prevent dehydration. The specimens were then scanned using a Micro-CT 35 (Scanco Medical, Brüttisellen, Switzerland) at a medium resolution of 30 μm. Three-dimensional reconstructions, 50 slices thick occlusoapically, were obtained from the 8 areas of interest of each specimen. Vertically, the bone analyzed was located approximately midway between the crests of the alveolar bone and the apices of the mesial and distal roots. At this level, segments of bone from the buccal and lingual cortices, bone mesial to the mesial root and distal to the distal root, and mesial and distal bundle bone were outlined. Fifty-slice-thick segments of interradicular control bone were also outlined at the same level. The threshold boundaries for the scans were set between 250 and 1000 Hounsfield units for all specimens.
The histologic specimens were obtained by removing with a trephine bur (Ace Surgical, Brockton, Mass) 3-mm-diameter samples of interradicular bone, taken midway between the crests of the alveolar bone and the mesial and distal root apices, from 6 specimens on the insult+ side, along with their respective controls (total of 12 samples). The tissues were fixed in 10% buffered formalin and washed thoroughly with tap water. They were then decalcified in .5 mol per liter of EDTA (ethylenediamine tetraacetic acid, tetrasodium salt) using the PELCO BioWave (Ted Pella, Inc, Redding, Calif). Radiographs were used to monitor the decalcification process. After decalcification, the specimens were dehydrated, cleared, infiltrated with paraffin with an automatic tissue processor (VIP model 2000; MilesCo Scientific, Fergus Falls, Minn), and embedded in paraffin blocks. The blocks were hardened on a cold plate and sectioned at 6 μm with a microtome. Five sections were chosen per block and mounted on 1 × 3-in coated glass slides, dried on a warming tray at 42° for 2 hours, and then dried overnight in an oven at 54°.
One slide per block was randomly selected to be stained using standard hematoxylin and eosin procedures. The number of osteoclasts on each slide was manually counted 3 times under 20-times magnification with a microscope (Zeiss, Thornwood, NY) and then averaged. Osteo software (version 11.2.6; Bioquant, Nashville, Tenn) was used to segment matrix bone tissue by adjusting threshold values; the bone was traced, and the bone surface area was calculated. When analyzing surface areas, the cut margins resulting from retrieval of the specimens with the trephine bur were segmented and excluded from the evaluation.
Statistical analysis
SPSS statistical software (version 18; IBM SPSS, Chicago, Ill) was used to describe the results and compare the groups. The nonparametric Wilcoxon signed rank test was used for all comparisons. Statistical significance was based on a P value of ≤0.05.
Results
The 3-dimensional reconstructions obtained from the scans were all 1.5 mm thick occlusoapically and ranged in width from 1 to 3 mm, depending on the distances between the tooth roots and/or the surgical cuts. The amount of surgical insult had a direct effect on the quantity and maturity of bone. Bone volume fraction and bone density were consistently less on the insult+ than on the insult sides. The insult+ side had significantly less material density in the distal, buccal, and lingual regions than did the insult side ( Table I ). The insult side also showed a significantly greater bone volume fraction than did the insult+ side in the buccal and mesial radicular regions.
| Bone index | Insult+ | Insult | Probability | ||
|---|---|---|---|---|---|
| Mean | SD | Mean | SD | ||
| Material density (mg HA/cm 3 ) | |||||
| Mesial | 847.2 | 30.7 | 866.4 | 20.9 | 0.208 |
| Distal | 795.7 | 32.6 | 867.6 | 27.8 | 0.012 |
| Buccal | 857.3 | 23.3 | 898.4 | 31.3 | 0.017 |
| Lingual | 881.5 | 19.6 | 905 | 14.6 | 0.050 |
| Mesial radicular | 835.8 | 35.6 | 866.1 | 28 | 0.123 |
| Distal radicular | 816.4 | 46.4 | 859 | 34.7 | 0.068 |
| Bone volume fraction (%) | |||||
| Mesial | 50.3 | 19 | 56.3 | 8 | 0.401 |
| Distal | 48.8 | 17 | 52.5 | 11 | 0.889 |
| Buccal | 70.2 | 8 | 90.1 | 5 | 0.012 |
| Lingual | 86.2 | 9 | 88.3 | 8 | 0.575 |
| Mesial radicular | 65.2 | 18 | 82.6 | 6 | 0.036 |
| Distal radicular | 57.1 | 23 | 73.9 | 12 | 0.208 |
The insult side also showed significantly ( P = 0.036) denser bone than did the insult+ side in the interradicular region. The interradicular bone of the insult and insult+ sides showed significantly ( P = 0.012) less material density than did the control bone ( Table II ). There were no statistically significant group differences in bone volume fraction of interradicular bone between the treatment groups and the controls.
| Bone index | Insult+ | Insult | Control | Probability | |||||
|---|---|---|---|---|---|---|---|---|---|
| Mean | SD | Mean | SD | Mean | SD | Insult+ vs insult | Insult+ vs control | Insult vs control | |
| Material density (mg HA/cm 3 ) | 837.5 | 19.9 | 856.1 | 16.3 | 929.1 | 30.8 | 0.036 | 0.012 | 0.012 |
| Bone volume fraction (%) | 36.1 | 7 | 35 | 11 | 34.7 | 13 | 0.779 | 0.779 | 0.779 |
| Trabecular number (n/mm) | 2.1 | 0.3 | 1.8 | 0.3 | 1.6 | 0.2 | 0.093 | 0.017 | 0.263 |
| Trabecular thickness (mm) | 0.2 | 0 | 0.3 | 0.1 | 0.3 | 0.1 | 0.111 | 0.042 | 0.203 |
| Trabecular separation (mm) | 0.5 | 0.1 | 0.6 | 0.1 | 0.7 | 0.1 | 0.123 | 0.012 | 0.176 |
The distal bone of the insult+ side showed significantly more trabeculae, significantly thinner trabeculae, and significantly less trabeculae separation than did the insult side ( Table III ). Compared with the controls ( Fig 3 , Table II ), the interradicular bone of the insult+ group showed significantly greater numbers of trabeculae ( P = 0.017), significantly thinner trabeculae ( P = 0.042), and significantly less trabecular separation ( P = 0.012).
| Bone index | Insult+ | Insult | Probability | ||
|---|---|---|---|---|---|
| Mean | SD | Mean | SD | ||
| Trabecular number (n/mm) | |||||
| Mesial | 2.5 | 0.5 | 2.6 | 0.6 | 0.779 |
| Distal | 3.7 | 0.8 | 2.4 | 0.4 | 0.017 |
| Trabecular thickness (mm) | |||||
| Mesial | 0.3 | 0.1 | 0.3 | 0.1 | 0.401 |
| Distal | 0.2 | 0 | 0.3 | 0 | 0.012 |
| Trabecular separation (mm) | |||||
| Mesial | 0.4 | 0.1 | 0.4 | 0.1 | 0.799 |
| Distal | 0.3 | 0.1 | 0.5 | 0.1 | 0.012 |
Stay updated, free dental videos. Join our Telegram channel
VIDEdental - Online dental courses


