Introduction
Initially, cone-beam computed tomography images from dry skulls were used to 3 dimensionally evaluate intrarater and interrater reliabilities and accuracy of selected 3-dimensional landmarks located in the anterior and middle cranial bases. Thereafter, dimensional changes of the anterior and middle cranial bases with growth were evaluated by using the previously selected landmarks.
Methods
Cone-beam computed tomography images of 10 dry skulls were used to identify useful landmarks from different areas of the anterior and middle cranial bases based on their reliability and accuracy. These selected landmarks were identified in the images of an already available sample of adolescents (n = 60) taken at 2 time points (19 months apart) to assess dimensional changes with growth.
Results
The majority of the proposed 3-dimensional landmarks with the exception of the lesser wing of the sphenoid showed acceptable intrarater and interrater reliabilities. The distances measured between foramina and canals in the transverse dimension showed evidence of increases in size. However, the mean amounts of increase in these transverse distances were equal to or less than 1.05 mm (from 1.1% to 4.1%). No change was observed between the right and left anterior and posterior clinoid processes. The vertical dimensions showed evidence of some changes, but these were within 2% of the original distances.
Conclusions
In this adolescent sample, minor growth-related changes were observed in the anterior and middle cranial bases. The midsagittal area of the anterior cranial base (foramen caecum to presphenoid) was stable. The right and left anterior and posterior clinoid processes can be used for transverse superimposition.
Highlights
- •
Anterior and middle cranial base growth has not been studied extensively in 3 dimensions in adolescents.
- •
Landmarks in the anterior and middle cranial bases are accurate and reliable.
- •
Minor growth changes were found in the anterior and middle cranial bases in adolescents.
Craniofacial growth and development knowledge is a cornerstone concept for the orthodontic specialty. Without an understanding of the normal growth pattern of the head, an orthodontist’s diagnosis and treatment planning is most likely destined to fail. Studies have stated that the anterior cranial base growth is completed early in life and even significantly before other craniofacial structures.
About 86% of the growth of the anterior cranial base is considered complete by the age of 4.5 years, and the remaining growth contributes to increases in the length of the anterior cranial base (sella-nasion) even after puberty. This means that the remaining 14% will be completed over a span of 12 to 18 years. Even considering this previous knowledge, the anterior cranial base has been used as a reference structure in diagnosis, treatment planning, and evaluation of treatment outcomes and changes during treatment of the craniofacial complex.
An analysis of the expected normal growth changes in the anterior cranial base is important. Increases in the thickness of the frontal bone, apposition in the glabella region, and the size of the frontal sinus contribute to increases in the length of the anterior cranial base for measurements such as the sella-nasion line due to the forward movement of nasion until adulthood (3.3% increase in this area of the frontal bone segment from age 6 to early adulthood ). The anteroposterior length of the presphenoid region was reported to be stable after the age of 7 years as assessed by cross-sectional and longitudinal studies. Björk observed remodeling of sella turcica during growth, resulting in displacement of sella downward and backward. He recorded an elevation of the tuberculum sella in relation to other structures of the anterior cranial fossa. The cribriform plate of the ethmoid is also considered stable after the age of 4 years.
As one can observe, changes in the anterior cranial fossa during postnatal growth are predominantly sagittal growth changes. To determine the stability of structures in all 3 planes of space (anteroposterior, transverse, and vertical), further analysis of the other planes is required.
Nowadays, for dental and maxillofacial surgery and orthodontic applications, cone-beam computed tomography (CBCT) can potentially overcome some limitations of all other previous imaging methods and measuring techniques. Analysis of CBCT images allows assessment of 3-dimensional (3D) dental, skeletal, and soft-tissue changes for both growing and nongrowing patients.
Based on this introduction, 3D changes in size and displacement of the cranial base structures outside the sagittal plane have not been synthesized in detail yet. In our study, the anterior and middle cranial base structural changes due to growth in adolescents were assessed in 3 dimensions using CBCT. Therefore, this article has 2 parts. First, intrarater and interrater reliabilities of selected landmarks in the anterior cranial base were assessed; second, the changes in the linear measurements derived from the proposed and validated landmarks were evaluated between 2 time points.
We attempted to elucidate whether some preselected structures of the anterior and middle cranial bases are stable in all dimensions during a specific time period. These structures, if proven to be stable, could be used in 3D superimposition techniques.
Material and methods
This investigation was a retrospective observational longitudinal study, approved by the health research ethics board at the University of Alberta in Canada (reference number Pro00043800).
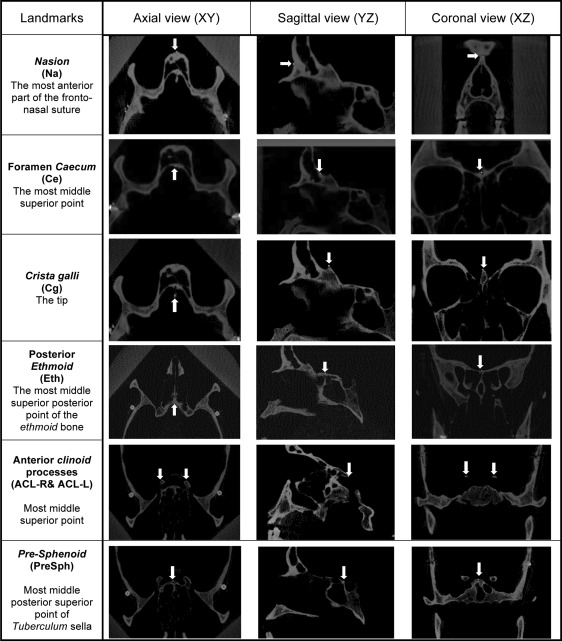
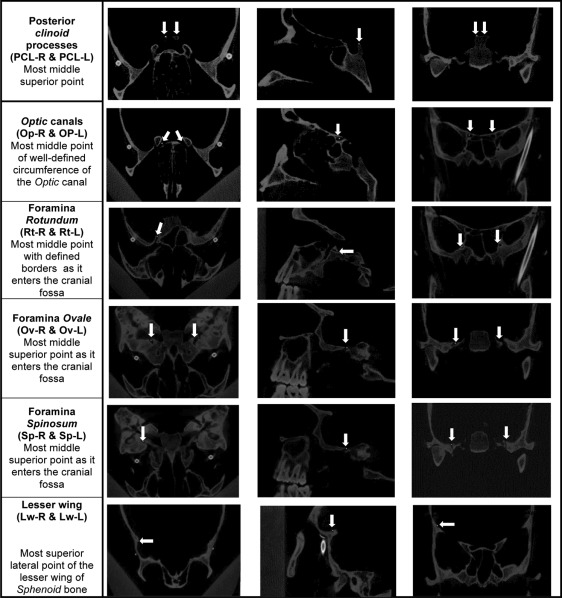
To determine intrarater and interrater reliabilities and accuracy of the landmarks, 10 dry skulls were imaged with a second-generation i-CAT machine (8.9 seconds exposure time, 16 × 13-cm field of view, 0.4 voxel size) (Imaging Sciences International, Hatfield, Pa). Nineteen landmarks ( Fig ) were considered and located on the skulls’ CBCT images using Avizo software (version 8.1; FEI Visualization Sciences Group, Mérignac Cedex, France). The images were viewed on a 14-in laptop monitor. The Avizo software allows for brightness and contrast adjustments. For intrarater reliability, this procedure was repeated 3 times for each skull with a week between trials by 1 investigator (M.A.). Coordinates were obtained for each landmark, and intrarater reliability was analyzed. To analyze the interrater reliability of landmark identification, 2 other investigators (M.L., C.F.) located the landmarks on the same 10 CBCT images of the skulls. The software creates the Cartesian origin (0,0,0) in each scan. This origin would always be the same for the same image, but it differs among different images. After we determined the reliability of the landmarks, these were marked in the dry skulls using gutta-percha. The same 10 skulls with gutta-percha were then reimaged, and coordinates were obtained from the gutta-percha positions. These coordinates from the gutta-percha marked landmarks were compared with the nongutta-percha marked landmarks to determine accuracy in identifying them. The reason for using dry skulls was to be able to identify reliable and accurate landmarks that can be used in the clinical data set. After we reviewed the results from the total of 19 landmarks, we eliminated 2 since they had low reliability values and were difficult to identify in the images.


To evaluate dimensional changes of the anterior and middle cranial bases with growth, CBCT images of adolescent subjects taken at 2 time points were used. The CBCT data were collected from a private practice generated from a second-generation i-CAT machine (with the same settings used for the skull data). One hundred forty-eight patients who completed orthodontic treatment between December 2008 and December 2011 were identified. Thirty-seven patients with incomplete records and 12 patients over 16 years of age at time point 1 (T1) were excluded. Therefore, a total of 99 patients had complete records with T1 and final (T2) CBCT images. From them, a final sample of 60 patients was selected. The University of Alberta orthodontic program policy does not require pretreatment and posttreatment CBCTs. The data in this study were gathered from preexisting CBCT images from a private practice. The patients had Class I and Class II malocclusions and received full fixed orthodontic treatment. Some patients had tooth-anchored expansion appliances. The assumption was that the provided orthodontic treatment did not influence the growth of the cranial base.
The inclusion criteria were the following.
- 1.
From the 99 sets of CBCT images, 30 subjects with an age range of 11 to 13 years and 30 subjects with an age range of 13 to 15.5 years who had the longest time interval between the T1 and T2 images were selected. The interval between T1 and T2 ranged from 14 to 24 months, with most at 17 to 20 months apart (patients with CBCTs beyond that range were not included to obtain a more homogenous sample in terms of differences between initial and final CBCT images).
- 2.
The cranial base was depicted completely in the CBCT images at both time points.
The mean age of the patients at T1 was 13 ± 1.1 years (minimum, 11 years; maximum, 15.4 years). The mean age at T2 and the mean difference between the 2 time points are given in Table I . The sample included 17 boys and 42 girls (sex of 1 patient was not recorded).
| n | Minimum | Maximum | Mean | SD | |
|---|---|---|---|---|---|
| Age at T1 (y) | 60.0 | 11.0 | 15.4 | 13.0 | 1.1 |
| Age at T2 (y) | 60.0 | 12.7 | 17.0 | 14.6 | 1.1 |
| T2 – T1 (y) | 60.0 | 1.2 | 2.0 | 1.6 | 0.2 |
To assess anterior and middle cranial base changes due to growth, 17 landmarks (which showed good intrareliability previously) were then located on the 3D images of the patients at T1 (pretreatment) and T2 (posttreatment). Twenty linear measurements were generated ( Table II ) using the following equation at each time point with the Cartesian coordinates of the landmarks.
d = ( x 2 − x 1 ) 2 + ( y 2 − y 1 ) 2 + ( z 2 − z 1 ) 2
Stay updated, free dental videos. Join our Telegram channel

VIDEdental - Online dental courses


