Introduction
The reasons for inaccuracies in alveolar bone measurement from cone-beam computed tomography (CBCT) images might be multifactorial. In this study, we investigated the impact of software, the presence or absence of soft tissues, the voxel size of the scan, and the regions in the jaws on buccal alveolar bone height measurements in pigs at an age equivalent to human adolescents.
Methods
Marker holes, apical to the maxillary and mandibular molar roots, and mesiodistal molar occlusal reference grooves were created in 6 fresh pig heads (12 for each jaw), followed by CBCT scans at 0.4-mm and 0.2-mm voxel sizes under soft-tissue presence and soft-tissue absence conditions. Subsequently, buccolingual sections bisecting the marker holes were cut, from which the physical alveolar bone height and thickness were measured. One blinded rater, using Dolphin (version 11.5 Premium; Dolphin Imaging, Chatsworth, Calif) and OsiriX (version 3.9; www.osirix-viewer.com ) software, independently collected alveolar bone height measurements from the CBCT images. Differences between the CBCT and the physical measurements were calculated. The mean differences and the limit of agreement (LOA, ±1.96 SD) for every jaw, voxel-size, soft-tissue, and software condition were depicted. Each measurement was then assessed for clinical inaccuracy by using 2 levels of criteria (absolute differences between CBCT and physical measurements ≥1 mm, or absolute differences between CBCT and physical measurements ≥0.5 mm), and the interactions between soft-tissue and voxel-size factors for every jaw and software condition were assessed by chi-square tests.
Results
Overall, the mean differences between the CBCT and the physical measurements for every jaw, voxel-size, soft-tissue, and software condition were near 0. With all other conditions kept equal, the accuracy of the maxillary CBCT measurements was inferior (larger limit of agreement ranges and higher frequencies of clinical inaccuracy) to the mandibular measurements. The physical thickness of the maxillary alveolar crestal bone was less than 1 mm and significantly thinner than the mandibular counterparts. For every jaw and software condition, the accuracy of measurements from the 0.2-mm soft-tissue presence CBCT images was consistently superior (smaller limit of agreement ranges and lower frequencies of clinical inaccuracy) to those from the 0.4-mm soft-tissue presence, the 0.4-mm soft-tissue absence, and the 0.2-mm soft-tissue absence images; all showed similar accuracies. Qualitatively, the soft-tissue absence images demonstrated much brighter enamel and alveolar bone surface contours than did the soft-tissue presence images.
Conclusions
At an adolescent age, the buccal alveolar bone height measured from the maxillary molar region based on 0.4-mm voxel-size CBCT images can have relatively large and frequently inaccurate measurements, possibly due to its thinness. By using 0.2-mm voxel-size scans, measurement accuracy might be improved, but only when the overlying facial and gingival tissues are kept intact.
With increasing popularity of cone-beam computed tomography (CBCT) imaging in orthodontics, researchers continue to question the appropriateness of using it to measure the height and thickness of the alveolar bone. Undoubtedly, compared with the basal bone in the jaws, the alveolar bone is more difficult to visualize and measure because of its thinness and proximity to the teeth and the periodontal ligament. On the other hand, when measuring the alveolar bone, it is critical to obtain measurements close to physical truth, since these measurements are often directly used to interpret periodontal health or sequelae from orthodontic treatment. For instance, underestimation of actual alveolar bone height would lead to a misdiagnosis of bone loss.
To date, reports on the accuracy of CBCT alveolar bone measurements have been somewhat inconsistent. Overall submillimeter limits of agreement were reported by Timock et al, indicating excellent accuracy for clinical use, but Patcas et al found up to 2.1 mm of limits of agreement in the mandibular incisor region, and Sun et al found that bone height was systematically underestimated by 0.9 to 1.2 mm when the bone thickness was near the voxel size. Although such inconsistencies are most likely due to variations in research designs and materials, they also suggest that the accuracy of alveolar bone measurements from CBCT images might depend on various factors.
Among many possible factors, several are often different in the studies, but they have been inadequately investigated. These include variations in scan voxel size, image analysis software, soft-tissue conditions (presence or absence), and alveolar bone regions in the jaws. Dry skulls without soft tissues have been commonly used for accuracy studies until recently, when researchers started using embalmed human cadavers. Although 1 group suggested that soft-tissue presence tends to reduce CBCT measurement precision in the mandibular incisor region, others found that soft-tissue presence did not compromise measurement accuracy. Similarly, decreasing voxel size has been found to increase the accuracy of alveolar bone measurements, but the interplay between this parameter and other factors (eg, soft tissues) remains unknown. In addition, buccal bone thickness generally differs between the 2 jaws, with a thinner maxillary bone. Whether such differences between the jaws affect the accuracy of CBCT measurements of the alveolar bone is currently unknown.
This study was aimed at understanding whether the variations in scanning voxel sizes, software for imaging analysis, soft-tissue presence or absence, and regions in the jaws impact the accuracy of alveolar bone height measurements from CBCT images. The discrepancies between CBCT and physical measurements were analyzed for each factor for mean differences, limits of agreement for each measurement, and proportions of clinically inaccurate measurements.
Material and methods
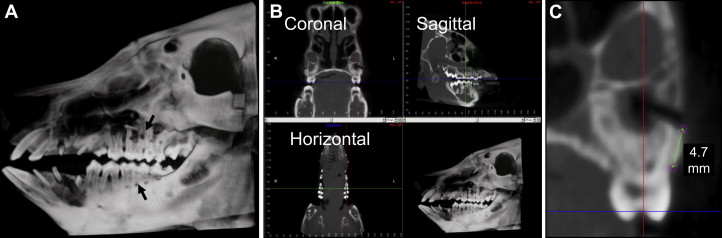
Six fresh domestic pig ( Sus scrofa ) heads, aged 3 to 6 months and equivalent to early adolescent humans, were used. Specimen preparation is shown in Figure 1 , A . Reference marker holes were drilled in the buccal alveolar bone at the apices of the first and second maxillary and mandibular molars with a slow-speed dental hand piece (Volvere VMax; Brasseler USA, Savannah, Ga). Marker holes were made intraorally through the buccal gingiva. Reference grooves bisecting the occlusal tables of all molars in a mesiodistal direction were also created. All 4 holes on the maxilla and the 3 mesial holes on the mandible were used in this study, and each hole was considered a sample for subsequent analyses. Three instead of 4 holes from each mandibular half were used, since the most distal hole involved the alveolar crest in some specimens.
Each head was scanned with an iCAT 17-19 Platinum CBCT machine (120 kVp, 5 mA) (Imaging Sciences International, Hatfield, Pa) at 0.4-mm voxel-size (scanning time, 8.9 seconds) and 0.2-mm voxel-size (scanning time, 26.9 seconds) levels. These constituted the soft-tissue presence CBCT images. Subsequently, superficial soft tissues, including skin, muscles, and gingival tissues covering the buccal alveolar bone, were dissected and removed without damaging the bone. Internal soft tissues, including the tongue, mucosa, and lingual gingivae, were not removed. The specimens were then rescanned at 0.4- and 0.2-mm voxel sizes with the same protocols as before soft-tissue removal. These constituted the soft-tissue absence CBCT images. Combined, a total of 24 sets of CBCT images were obtained for analyses.
After the soft-tissue absence scans, each maxillary or mandibular quadrant was separated from the head by using a Ryobi 9-in band saw (Techtronic Industries North America, Anderson, SC). The specimens were further cut into sections that bisected the marker holes and in a direction perpendicular to the molar occlusal groove, by using an IsoMet low-speed saw (Buehler, Lake Bluff, Ill) under water lubrication. This resulted in 2 mirror sections for each marker hole, which were used to obtain the physical measurements of alveolar bone height and thickness. Using a digital caliper, 2 raters (R.W. and Z.S.) took these measurements independently according to the same protocol. Bone height was measured from the occlusal border of the marker hole to the crest of the alveolar bone. Bone thickness was measured at 2 locations along the buccal surface: 0.5 and 1.0 mm from the alveolar bone crest. The distance (perpendicular to the root’s long axis) between the buccal surface and the buccal bundle bone surface was measured. The measurements from the 2 mirror sections of each marker hole were averaged. These measurements were tested for interrater reliability before further combination (detailed below). No intrarater reliability was tested for these physical measurements.
One rater (R.W.) measured the CBCT images. The CBCT data (DICOM, Rosslyn, Va) were relabeled and reordered randomly to blind the rater. The rater was trained by an experienced oral and maxillofacial radiologist (J.C.) on how to take linear measurements from CBCT images and then independently measured the height of the buccal alveolar bone using the following protocol.
After setting the resolution of the display monitor at 1600 × 1200 pixels, the CBCT data were imported into the software, Dolphin Imaging (version 11.5 Premium; Dolphin Imaging, Chatsworth, Calif) or OsiriX (version 3.9; www.osirix-viewer.com ). Slice thickness was set at 0.5 mm in coronal, sagittal, and axial views. Then the specimen’s occlusal groove was made parallel to the axial and sagittal planes; this oriented the coronal views perpendicular to the groove ( Fig 1 , B ). In the coronal view, which is equivalent to the sections used for physical measurement, buccal alveolar bone height at each marker hole was measured. The linear measurement tool, available in both software programs, was used to measure alveolar bone height, which was the distance from the occlusal border of the marker hole to the alveolar crest ( Fig 1 , C ). During analysis, the rater was allowed to enlarge the images but not to digitally change the images in any other way.
Eight repeated CBCT measurements were obtained from each marker hole under varied conditions as a result of the 2 × 2 × 2 design of 3 factors, with each having 2 subcategories (software, Dolphin or Osirix; soft tissues, presence or absence; voxel size, 0.4 or 0.2 mm). The rater was blinded to the conditions when taking the measurements.
To assess intrarater reliability, 8 sets of CBCT images were randomly chosen for remeasurement 6 weeks after the initial measurements. The same protocols were followed for the remeasurements.
Statistical analysis
Intrarater reliability values (for CBCT measurements only) and interrater reliability (for physical measurements only) were assessed by intraclass correlation tests. The differences between each set of CBCT and physical measurements were calculated and used as a parameter, D CBCT-Phy . The variances of D CBCT-Phy caused by the factors of software, soft tissue, and voxel size were tested by repeated-measures analysis of variance (ANOVA) with the maxilla and the mandible separated. The mean D CBCT-Phy and the limit of agreement (LOA, ±1.96 SD) for each condition were compared with the Bland-Altman method.
Subsequently, to further examine the clinical implications of the discrepancies between the CBCT and the physical measurements, the continuous D CBCT-Phy data were converted to 1 of 2 categorical values: clinically accurate or clinically inaccurate. Two levels of criteria (absolute D CBCT-Phy value ≥1 or ≥0.5 mm) were used to determine the clinical inaccuracy, from which the proportion of clinically inaccurate measurements was calculated for every condition. The interactions between the voxel-size and soft-tissue factors under varied jaw, inaccuracy criteria, and software conditions were tested with chi-square tests.
The physical measurements of alveolar bone thickness were compared between the maxilla and the mandible by 2-sample t tests.
Results
Interrater reliability of the alveolar bone height physical measurements was excellent (correlation coefficients: maxilla, 0.98; mandible, 0.95), so the measurements from the 2 raters were averaged and used for comparisons with the CBCT measurements.
Intrarater reliability values of the CBCT alveolar bone height measurements were excellent (correlation coefficients: maxilla, 0.98; mandible 0.97).
The mean differences between CBCT and physical measurements and limit of agreement range for every jaw and software condition are listed in Table I . In the maxilla, ANOVA showed that no factors significantly changed the mean D CBCT-Phy , which were in the range of −0.04 and 0.14 mm, respectively. In the mandible, although ANOVA showed a significant interaction among software, soft-tissue, and voxel-size factors, even the greatest differences between the CBCT and physical measurements among them were less than 0.2 mm ( Table I ). All limit of agreement ranges were greater in the maxilla (all >2 mm except for the 0.2-mm soft-tissue presence condition) than in the mandible (all >1 mm except for the 0.2-mm soft-tissue presence condition). With all other factors kept equal, the limit of agreement values were nearly identical between the Dolphin and Osirix software conditions.
| 0.4-mm STP | 0.4-mm STA | 0.2-mm STP | 0.2-mm STA | |
|---|---|---|---|---|
| Maxilla | ||||
| Dolphin | 0.08 ± 2.23 | 0.14 ± 2.24 | −0.03 ± 1.03 | 0.04 ± 2.22 |
| OsiriX | 0.05 ± 2.16 | 0.08 ± 2.27 | −0.04 ± 1.06 | −0.03 ± 2.11 |
| Mandible | ||||
| Dolphin | 0.05 ± 1.29 | 0.22 ± 1.26 | −0.04 ± 0.64 | −0.02 ± 1.01 |
| OsiriX | −0.10 ± 1.26 | 0.06 ± 1.23 | −0.09 ± 0.64 | 0.06 ± 1.23 |
| LOA: Mx-Mn | ||||
| Dolphin | 0.94 | 0.98 | 0.39 | 1.21 |
| OsiriX | 0.90 | 1.04 | 0.42 | 0.88 |
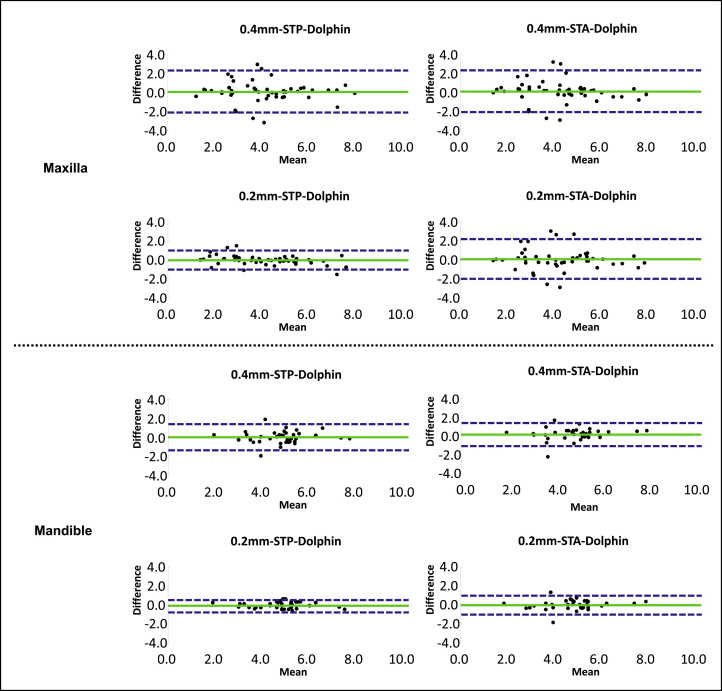
The Bland-Altman plots of the maxilla and the mandible with the Dolphin software are shown in Figure 2 . The patterns of the Osirix plots are not shown because they were similar to those of Dolphin. In both jaws, with the other factors kept equal, the soft-tissue presence 0.2-mm voxel-size subcategory demonstrated a substantially smaller limit of agreement range and less scatter of data points than those of the other 3 subcategories, which were generally similar.
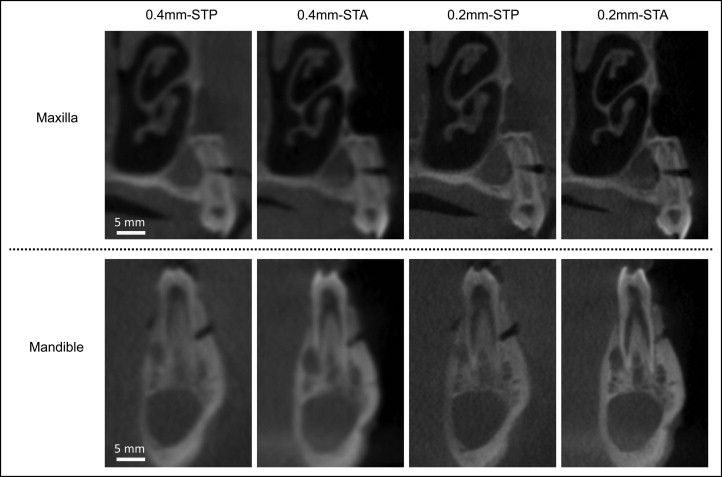
Examples of buccolingual CBCT images of the maxillary and mandibular alveolar bones from the same animal with the same protocols and settings, but under varied voxel-size and soft-tissue conditions, are shown in Figure 3 . Overall, the 0.2-mm voxel-size images appeared clearer than did the 0.4-mm voxel-size images, and the dentoalveolus in the soft-tissue absence images showed greater surface contour brightness and contrast than those in the soft-tissue presence images. This difference in brightness was especially prominent at the enamel and buccal alveolar bone surfaces between the 0.2-mm soft-tissue presence and the 0.2-mm soft-tissue absence images. These patterns did not change with the software programs.
The proportions of clinically inaccurate measurements are shown in Table II . First, the proportions of inaccurate measurements were lower in the mandible than in the maxilla, and lower at the 1-mm inaccuracy criterion (absolute D CBCT-Phy value ≥1 mm) than at the 0.5-mm inaccuracy criterion (absolute D CBCT-Phy value ≥0.5 mm). Next, with the jaw, inaccuracy criterion and software conditions kept equal, the soft-tissue presence 0.2-mm subcategory demonstrated a substantially lower value than those of the other 3 categories, which were generally similar. The interaction between the voxel-size and soft-tissue factors was not statistically significant when tested separately for every condition but reached significance when the measurements from both software conditions were pooled and compared at the 1-mm inaccuracy criterion. At the 0.5-mm inaccuracy criterion, the interaction was nearly significant for the maxilla but not for the mandible.
| Jaw, inaccuracy criterion, software | 0.4-mm STP | 0.4-mm STA | 0.2-mm STP | 0.2-mm STA | Interaction of voxel size and soft tissues (software separated) | Interaction of voxel size and soft tissues (software values pooled) |
|---|---|---|---|---|---|---|
| Mx: |D CBCT-Phy | ≥1 mm | P = 0.03 | |||||
| Dolphin | 25.00% | 22.92% | 8.33% | 25.00% | P = 0.09 | |
| OsiriX | 27.08% | 22.92% | 10.42% | 22.92% | P = 0.15 | |
| Mn: |D CBCT-Phy | ≥1 mm | P = 0.03 | |||||
| Dolphin | 13.90% | 11.11% | 0.00% | 5.66% | P = 0.15 | |
| OsiriX | 8.33% | 11.11% | 0.00% | 11.11% | P = 0.13 | |
| Mx: |D CBCT-Phy | ≥0.5 mm | P = 0.09 | |||||
| Dolphin | 39.58% | 39.58% | 22.92% | 37.50% | P = 0.33 | |
| OsiriX | 43.75% | 35.42% | 22.92% | 37.50% | P = 0.16 | |
| Mn: |D CBCT-Phy | ≥0.5 mm | P = 0.25 | |||||
| Dolphin | 22.22% | 27.87% | 5.56% | 11.11% | P = 0.63 | |
| OsiriX | 22.22% | 19.44% | 8.33% | 19.44% | P = 0.25 |
Stay updated, free dental videos. Join our Telegram channel
VIDEdental - Online dental courses


