Introduction
The aims of this study were to (1) assess lateral facial morphology in children and adolescents with juvenile idiopathic arthritis and moderate to severe temporomandibular joint (TMJ) involvement, (2) compare the lateral facial morphology of these subjects with and without TMJ involvement using cephalograms and 3-dimensional (3D) facial photographs, and (3) compare and correlate the results of the 3D photographic and cephalometric analyses.
Methods
Sixty patients with juvenile idiopathic arthritis were included and grouped as follows: group 1, juvenile idiopathic arthritis patients without TMJ involvement; group 2, juvenile idiopathic arthritis patients with moderate to severe unilateral TMJ involvement; and group 3, juvenile idiopathic arthritis patients with moderate to severe bilateral TMJ involvement. Lateral cephalograms were used to assess and compare lateral facial morphologies between the groups. Lateral projections of oriented 3D photographs were superimposed on the lateral cephalograms. The results of the lateral 3D photographic analysis were correlated with those of lateral cephalometric analysis.
Results
Group 3 showed the most severe growth disturbances, including more retrognathic mandible and retruded chin, steep occlusal and mandibular planes, and more hyperdivergent type ( P <0.01). Group 2 showed similar growth disturbances, but to a lesser extent than did group 3. Photographic variables were significantly correlated with the soft tissue and skeletal variables of cephalograms (0.5 < r < 0.9; P <0.001).
Conclusions
Subjects with juvenile idiopathic arthritis and unilateral or bilateral moderate to severe TMJ involvement had significant growth disturbances. Early intervention is recommended for these patients to prevent unfavorable facial development. Furthermore, with proper orientation, 3D photographs can be used as an alternative to conventional lateral cephalograms and 2-dimensional photographs.
Highlights
- •
We evaluated lateral facial morphology of juvenile idiopathic arthritis patients with moderate and severe TMJ involvement.
- •
Differences in their lateral facial morphologies between unilateral and bilateral TMJ involvement were also assessed.
Juvenile idiopathic arthritis is a chronic autoimmune, inflammatory joint disease. It may affect the temporomandibular joint (TMJ) and cause severe growth disturbances such as mandibular micrognathia, retrognathia, steeper mandibular plane angle, and increased facial convexity. Although several researchers have reported the typical facial morphologic characteristics in children with juvenile idiopathic arthritis, most of them did not consider TMJ involvement while assessing lateral facial morphology; moreover, dentofacial morphology has been found to vary widely in these studies because of the extreme heterogeneity of the samples. In addition, in most of these studies, the children with juvenile idiopathic arthritis were compared with healthy children with normal occlusions or Class II malocclusions. To our knowledge, thus far, no study has evaluated lateral facial morphology in children and adolescents with juvenile idiopathic arthritis and moderate to severe TMJ involvement, and compared their morphologic characteristics with those of children and adolescents with juvenile idiopathic arthritis but without discernable condylar lesions. A better understanding of the impact of moderate to severe TMJ involvement on lateral facial morphology in children with juvenile idiopathic arthritis may help to determine the prognosis of their growth impairment.
Advances in technology have ushered craniofacial researchers into the era of 3-dimensional (3D) imaging. Among the various 3D imaging methods, 3D photographs have become more readily available and can be used to record 3D facial morphology. The advantages include small method errors, quick image capture (in a millisecond), high spatial resolution, and no ionizing radiation. These properties make it well suited for longitudinal documentation of facial morphology, especially in children. Our previous work has shown that use of 3D photographs is a good method to assess and quantify facial asymmetry in patients with juvenile idiopathic arthritis. In addition, 3D photographs might also be suitable for evaluating and comparing facial profiles in the sagittal and vertical dimensions, as an alternative to the more commonly used 2-dimensional cephalograms and lateral photographs that are already well established and widely accepted. At present, no routinely used reference system exists for an appropriate orientation of 3D photographs when comparing lateral facial morphology in 3 dimensions. A comparison and correlation between the results of 3D photographic and cephalometric analyses could provide a reference system and elucidate the advantages and limitations of using 3D photographs to assess facial profiles.
The purposes of this study were to (1) assess lateral facial morphology in children and adolescents with juvenile idiopathic arthritis without and with moderate to severe TMJ involvement, (2) compare lateral facial morphology between these groups using lateral cephalograms and lateral 3D facial photographs, and (3) compare and correlate the results of the photographic and cephalometric analysis.
Material and methods
This retrospective study included children and adolescents with juvenile idiopathic arthritis (mean age, 12.7 ± 3.2 years; range, 4-18.5 years; Table I ) attending annual TMJ examinations at the School of Dentistry, Faculty of Health and Medical Sciences at the University of Copenhagen in Denmark between 2008 and 2014. The inclusion criteria were as follows: (1) juvenile idiopathic arthritis diagnosed and treated medically according to the guidelines of the Department of Pediatric Rheumatology at Copenhagen University Hospital Rigshospitalet; (2) cephalometric and panoramic films and 3D photographs available at the same visit; (3) no history of maxillofacial surgery; and (4) no genetic diseases, syndromes, or other congenital deformities.
| Group 1 | Group 2 | Group 3 | Total | P | |
|---|---|---|---|---|---|
| Sex, n (%) | |||||
| Male | 7 (35) | 5 (25) | 3 (15) | 15 (25) | 0.344 ∗ |
| Female | 13 (65) | 15 (75) | 17 (85) | 45 (75) | |
| Age (y) | 12.7 ± 3.6 | 12.8 ± 3.4 | 12.5 ± 2.9 | 12.7 ± 3.2 | 0.963 † |
| Age range (y) | 4.3-18.3 | 4.7-17.5 | 8.0-18.5 | 4.3-18.5 | |
The diagnosis of the TMJ involvement was confirmed by both clinical and radiographic findings. The TMJs were scored on a 4-point scale on the panoramic radiographs as follows: no involvement (score 0), slight erosion or breakdown of the superficial cortical bone of the condyle (score 1), manifest erosion and flattening of the condyle (score 2), or complete destruction of the condyle (score 3). The TMJs were scored twice by 2 examiners (Y-J.H., S.K.). Conferring between the examiners was not allowed, and the final score for each panoramic film was agreed by consensus between the 2 examiners.
Twenty children and adolescents with juvenile idiopathic arthritis and without TMJ involvement were consecutively enrolled into group 1 (bilateral TMJ involvement, score of 0). Twenty children and adolescents with juvenile idiopathic arthritis and a unilateral TMJ involvement score of 2 or 3 (the other side scored 0) were enrolled into group 2, and 20 children and adolescents with juvenile idiopathic arthritis and a bilateral TMJ involvement score of 2 or 3 were enrolled into group 3.
All cephalometric radiographs and 3D photographs were taken by the same trained radiographer at the School of Dentistry at the University of Copenhagen. The cephalometric films were acquired with the patient’s head in natural head position with maximum intercuspation and the lips at rest. Between 2008 and 2012, the cephalometric radiographs were obtained using a conventional development process and were taken with a cephalostat developed by Solow and Kreiborg. The conventional cephalometric radiographs were scanned to obtain analog digital images using an Epson Expression scanner (1640XL; Epson, Long Beach, Calif) with 300 dpi resolution. After 2012, the cephalometric radiographs were taken with a ProMax 3D device (Planmeca, Helsinki, Finland), which provides phosphor-simulated direct digital radiographic images. Identification of all landmarks and digitizations and measurements of the cephalometric films were carried out by the same investigator (Y-J.H.) using the TIOPS program ( Tiops.com ; Roskilde, Denmark). All variables were angular measurements to eliminate size differences because of the wide age range and mixed sexes of the subjects. Thirteen variables were used to describe the skeletal structures, and 8 variables were used to assess the soft tissue profile. The definitions of the landmarks and reference lines are provided in Tables II and III .
| Abbreviation | Name | Definition |
|---|---|---|
| Landmarks | ||
| ar | Articulare | Intersection between the external contour of the cranial base and the posterior contour of the condyle |
| ba | Basion | Most posteroinferior point on the anterior margin of the foramen magnum |
| gn | Gnathion | Most inferior point of the mandibular symphysis |
| n | Nasion | Most anterior point of the frontonasal structure |
| pg | Pogonion | Most anterior point on the mandibular symphysis |
| s | Sella | Center of the sella turcica; the upper limit of the sella turcica is defined by a line from the tuberculum to the dorsum sella |
| sm | Supramentale | Most posterior point on the anterior contour of the lower alveolar process |
| ss | Subspinale | Most posterior point on the anterior contour of the upper alveolar process |
| Reference lines | ||
| ML | Mandibular line | Line through gn and the tangent point to the inferior contour of the mandible through gn |
| NL | Nasal line | Line through the apex of the anterior nasal spine and the intersection point of the nasal floor and posterior contour of the maxilla |
| NSL | Nasion-sella line | Line through n and s |
| OLf | Functional occlusal line | Line through the cusp tip of the mandibular first premolar and the medial cusp of the maxillary molar |
| OLs | Upper occlusal line | Line through the midpoint of the incisal edge of the most prominent maxillary central incisor and the medial cusp of the maxillary molar |
| RLar | Ramus line | Line through ar and the tangent point to the posterior contour of the mandibular ramus through ar |
| Abbreviation | Name | Definition | |
|---|---|---|---|
| Cephalometric | Photographic | ||
| llt | llt′ | Lower lip tangent point | Upper tangent point of the tangent to the lower lip through sms |
| lnt | lnt′ | Lower nasal tangent point | Upper tangent point of the nose-chin line (NCL) |
| ls | ls′ | Labrale superious | Most prominent point on the prolabium of the upper lip |
| ns | ns′ | Soft tissue nasion | Deepest point in the frontonasal curvature |
| nst | nst′ | Nasal septum tangent point | Anterior tangent point of the tangent to the nasal septum through sn |
| pgs | pgs′ | Soft tissue pogonion | Most prominent point on the chin |
| prn | prn′ | pronasale | Most prominent point on the apex of the nose |
| sms | sms′ | Soft-tissue supramentale | Deepest point in the mentolabial sulcus |
| sn | sn′ | Subnasale | Deepest point in the nasolabial curvature |
| sss | sss′ | Soft-tissue subspinale | Most dorsal point of the upper lip contour |
| unt | unt′ | Upper nasal tangent point | Nasal tangent point of the NFL |
| tra | Tragion | Junction of the tragus and the crus of the helix | |
| mn | Midpoint of nose | Midpoint of ns′ and prn′ | |
| Reference lines | |||
| NCL | NCL′ | Nose-chin line | Tangent line through nose and chin |
| NFL | NFL′ | Nose-frontal line | Tangent line through frontal region to nose |
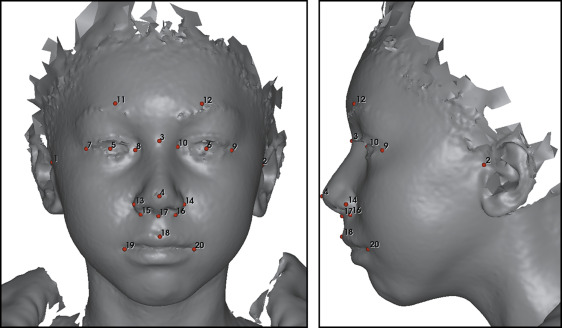
The 3D photographs were obtained with 3dMDface and 3dMDtrio face stereophotogrammetric systems (3dMD, Atlanta, Ga). All subjects sat in a chair and tilted their head slightly backward to a similar degree while the 3D photographs were taken. In addition, they were instructed to maintain a neutral facial expression during data collection, which lasted for 2.5 ms. Eighteen manually placed landmarks were used for rigid orientation of all the 3D photographs ( Fig 1 ) relative to a standard oriented 3D face photograph. The orientation process was carried out using the landmarker software (3D Craniofacial Image Research Laboratory, University of Copenhagen, Copenhagen, Denmark), which has been described by Darvann et al. The 3D surfaces were oriented using a reference frame defined as follows: (1) the axial plane was the Frankfort horizontal (FH) plane defined by the plane passing through the bilateral tragions and the midpoint of soft tissue nasion and pronasale, (2) the coronal plane was perpendicular to the FH plane and passed through the left tragion, and (3) the midsagittal plane was perpendicular to the FH and coronal planes and passed through the midpoint of nasion and pronasale.
The lateral projection of the 3D photograph was manually superimposed on the cephalogram by translation and rotation until the best fit of the profiles of the 2 images was reached. To investigate the correlations between lateral cephalometric and 3D photographic analyses, the same soft tissue analysis was performed on lateral projections of the 3D photographs as on the lateral cephalograms.
In addition to the cephalometric soft tissue analysis, 5 additional variables were used to investigate the correlations between soft tissue variables of lateral 3D photographs and skeletal variables of lateral cephalometric analysis: (1) tragion (tra)-ns′-sss′; (2) tra-ns′-pgs′; (3) tra-ns′-sms′; (4) nasion-sella line (NSL)/tra-mn, angle between NSL and line formed by tra and midpoint of ns′ and prn′; and (5) NSL/tra-ns′, angle between NSL and lined formed by tra and ns′ ( Tables II and III ).
Digitization of landmarks and measurements was carried out twice (separated by at least 2 weeks) by the same investigator for 30 randomly chosen patients. The random intraexaminer errors were calculated using the Dahlberg formula and ranged from 0.4 to 1.4 mm or degrees.
Statistical analysis
Data were analyzed using a statistical package SPSS (version 17.0; SPSS, Chicago, Ill). All descriptive statistics are presented as means and standard deviations. The chi-square test was used to test whether there were sex differences among the 3 groups. Analysis of variance (ANOVA) was used to determine whether there were significant differences in age and cephalometric measurements among the 3 groups, and a post-hoc test (Bonferroni) was undertaken to identify the source of the differences. The Pearson correlation test was used to determine correlations between the variables of lateral cephalometry and those of the lateral 3D photographs. The paired t test was used to identify significant differences between the soft tissue measurements of lateral cephalometry and those of lateral 3D photographs. The level of significance was set at P <0.05.
Results
The demographic data of the 3 groups are shown in Table I . The age and sex distributions were not significantly different between the groups.
The mean results of the lateral cephalometric analysis of the 3 groups are shown in Table IV and Figure 2 . Group 3 (bilateral TMJ involvement) had significantly smaller n-s-ar and s-n-pg angles and larger ss-n-sm and ss-n-pg angles than those of groups 1 and 2. The patients with unilateral TMJ involvement (group 2) also showed a significantly smaller s-n-pg angle and a larger ss-n-pg angle than those of group 1. With regard to the vertical relationship, patients in groups 2 and 3 had larger NSL/ML, OLs/NL, and NL/ML angles than did those in group 1. In addition, patients with bilateral TMJ involvement (group 3) showed larger NSL/Olf, NSL/ML, and NL/ML angles than those of the other 2 groups. With regard to soft tissue analysis, compared with groups 1 and 2, group 3 showed significantly larger sss-ns-sms, sss-ns-pgs, and sn-ns-pgs angles and smaller ns-sn-pgs, NFL-NCL, and ns-unt/NCL angles. Group 2 showed only a significantly smaller ns-unt/NCL angle than that of group 1, and no significant differences were observed among the other soft tissue variables.
| Measurement (°) | Group 1 ∗ | Group 2 ∗ | Group 3 ∗ | P † | 1 vs 2 ‡ | 1 vs 3 ‡ | 2 vs 3 ‡ |
|---|---|---|---|---|---|---|---|
| Skeletal (cephalometric) | |||||||
| n-s-ar | 125.7 ± 4.8 | 123.1 ± 5.6 | 117.2 ± 4.7 | <0.001 | 0.308 | <0.001 | 0.002 |
| n-s-ba | 131.8 ± 4.4 | 132.5 ± 5.6 | 130.0 ± 3.0 | 0.207 | |||
| ML/Rlar | 120.2 ± 7.3 | 121.6 ± 7.3 | 124.3 ± 6.1 | 0.169 | |||
| S-n-ss | 81.4 ± 3.9 | 80.4 ± 3.1 | 80.6 ± 3.7 | 0.661 | |||
| S-n-sm | 77.2 ± 3.8 | 75.0 ± 2.6 | 72.6 ± 4.1 | 0.001 | 0.064 | <0.001 | 0.100 |
| S-n-pg | 78.1 ± 3.4 | 75.5 ± 2.9 | 71.9 ± 4.5 | <0.001 | 0.044 | <0.001 | 0.008 |
| ss-n-sm | 4.1 ± 1.9 | 5.4 ± 1.9 | 8.0 ± 2.8 | <0.001 | 0.263 | <0.001 | 0.001 |
| ss-n-pg | 3.2 ± 2.1 | 4.9 ± 2.4 | 8.7 ± 3.4 | <0.001 | 0.155 | <0.001 | <0.001 |
| NSL/NL | 9.2 ± 3.7 | 7.8 ± 2.9 | 9.2 ± 3.1 | 0.316 | |||
| NSL/Olf | 21.0 ± 3.9 | 23.0 ± 5.3 | 27.9 ± 5.1 | <0.001 | 0.574 | <0.001 | 0.006 |
| NSL/ML | 31.2 ± 4.4 | 35.8 ± 6.0 | 42.3 ± 6.1 | <0.001 | 0.033 | <0.001 | 0.001 |
| NL/ML | 22.1 ± 5.9 | 28.0 ± 4.7 | 33.1 ± 5.5 | <0.001 | 0.003 | <0.001 | 0.013 |
| OLs/NL | 8.9 ± 4.4 | 12.6 ± 4.0 | 13.8 ± 4.3 | 0.001 | 0.020 | 0.002 | 1.000 |
| Soft tissue (cephalometric) | |||||||
| sss-ns-sms | 8.3 ± 1.8 | 9.6 ± 1.7 | 11.9 ± 2.8 | <0.001 | 0.198 | <0.001 | 0.005 |
| sss-ns-pgs | 7.1 ± 2.3 | 8.7 ± 2.2 | 11.8 ± 2.9 | <0.001 | 0.128 | <0.001 | 0.001 |
| sn-ns-pgs | 8.7 ± 2.3 | 10.1 ± 2.2 | 12.8 ± 3.1 | <0.001 | 0.255 | <0.001 | 0.005 |
| ns-sn-pgs | 162.1 ± 4.8 | 159.1 ± 4.6 | 153.8 ± 6.4 | <0.001 | 0.085 | <0.001 | 0.003 |
| NFL-NCL | 144.5 ± 4.5 | 141.6 ± 5.9 | 137.2 ± 7.2 | 0.001 | 0.383 | 0.001 | 0.074 |
| ns-unt/NCL | 129.7 ± 4.0 | 125.0 ± 4.3 | 122.3 ± 6.5 | <0.001 | 0.014 | <0.001 | 0.274 |
| nst-sn-ls | 115.5 ± 10.6 | 116.5 ± 10.3 | 116.6 ± 11.2 | 0.062 | |||
| llt-sms-pgs | 126.7 ± 16.7 | 131.5 ± 12.6 | 131.9 ± 14.6 | 0.468 | |||
| Soft tissue (photographic) | |||||||
| sss′-ns′-sms′ | 8.5 ± 1.9 | 9.4 ± 1.7 | 11.1 ± 2.7 | 0.002 | 0.545 | 0.001 | 0.050 |
| sss′-ns′-pgs′ | 7.8 ± 2.2 | 9.4 ± 2.2 | 11.7 ± 2.9 | <0.001 | 0.152 | <0.001 | 0.012 |
| sn’-ns′-pgs′ | 9.6 ± 2.3 | 11.1 ± 2.0 | 13.2 ± 3.3 | <0.001 | 0.229 | <0.001 | 0.040 |
| ns′-sn′-pgs′ | 160.6 ± 4.8 | 157.7 ± 4.6 | 153.6 ± 6.6 | 0.001 | 0.278 | <0.001 | 0.060 |
| NFL′-NCL′ | 143.8 ± 4.6 | 141.3 ± 5.5 | 137.6 ± 7.1 | 0.006 | 0.510 | 0.004 | 0.161 |
| ns′-unt′/NCL′ | 129.0 ± 4.1 | 125.3 ± 3.8 | 123.0 ± 6.4 | 0.001 | 0.057 | 0.001 | 0.452 |
| nst′-sn′-ls′ | 121.7 ± 9.2 | 120.9 ± 7.9 | 119.3 ± 11.1 | 0.730 | |||
| llt′-sms′-pgs′ | 137.6 ± 16.7 | 139.0 ± 11.4 | 142.9 ± 14.9 | 0.489 | |||
| tra-ns′-sss′ | 81.2 ± 3.3 | 81.2 ± 2.7 | 79.8 ± 3.5 | 0.307 | |||
| tra-ns′-pgs′ | 73.3 ± 3.4 | 71.8 ± 3.2 | 68.1 ± 4.5 | <0.001 | 0.612 | <0.001 | 0.009 |
| tra-ns′-sms′ | 72.6 ± 3.4 | 71.7 ± 2.8 | 68.7 ± 4.5 | 0.004 | 1.000 | 0.004 | 0.036 |
| NSL′/tra-mn | 5.0 ± 2.4 | 5.4 ± 2.6 | 3.6 ± 2.3 | 0.050 | |||
| NSL′/tra-ns′ | 173.4 ± 2.4 | 173.9 ± 2.9 | 172.3 ± 2.4 | 0.165 | |||
Stay updated, free dental videos. Join our Telegram channel
VIDEdental - Online dental courses


