Introduction
Long-term soft tissue response to extraction orthodontic treatment has been a subject of interest for years. The purposes of this study were to investigate long-term soft tissue profile changes in an extraction sample and to compare them with profile changes in an untreated sample.
Methods
A premolar extraction–treated sample (n = 47) and an untreated control sample (n = 57) were studied. Descriptive statistics were collected, and individual t tests were used for comparison and contrast of the treated and untreated samples.
Results
We found that the untreated soft tissue profile changed in the downward and forward direction. The treated soft tissue profile change was similar, but with more of a forward component than in the untreated sample. Most noteworthy was the finding that the soft tissue profiles of both the untreated and the treated samples were similar at the end point.
Conclusions
The following conclusions were derived from the study. (1) There was no substantive difference in the soft tissue profiles of the samples, but there were some differences in the directional changes between them. (2) The changes for the untreated sample were the greatest for the lips and the chin, with the change occurring in the downward and forward direction. (3) The soft tissue profiles of the extraction sample also had the greatest measurable changes in the lips and the chin, but the changes had more of a forward component than they did in the untreated sample. (4) Extraction treatment does not adversely impact soft tissue profile changes over time.
Highlights
- •
Profiles of a sample of extraction patients who were treated 25 years ago were compared with profiles of a matched control sample of adults who had no treatment.
- •
No substantive esthetic differences were found between treated and control groups.
- •
Soft tissue changes for both groups were the greatest for the lips and chin.
- •
Growth was more forward in extraction patients, more downward in untreated controls.
- •
Extraction treatment does not have a deleterious impact on the facial profile.
Facial esthetic ideals were documented as early as 4 bc by the Greeks and were studied by the Egyptians, Romans, and Italians. Many ideas that surround the correction of the irregularities of teeth were first published in Britain by Kingsley in 1880, but the author did not address the relationship between esthetics and orthodontics. In 1900, Angle formally established orthodontics as a dental specialty and insisted that patients whose full complement of teeth was maintained would have superior occlusions. He was one of the first to define a relationship between orthodontics and facial esthetics. Angle strongly believed that once a superior occlusion was achieved, excellent facial esthetics would be the result. Tweed challenged Angle’s concepts solely on esthetic grounds. He documented the fact that a normal complete dentition occlusion does not always predispose the patient to ideal facial balance. Tweed recognized that facial balance and harmony could not be achieved because many patients who were treated without extractions had protrusive lips and faces. He contended that these patients had profiles that were not esthetically pleasing because the teeth were too far forward.
Over the years, cephalometric “norms” have been defined by the specialty. The effect of growth on the soft tissue profile began to be addressed by investigators who detailed changes due to growth alone. In 1985, Behrents documented long-term soft tissue changes in an untreated sample. He studied subjects from the Bolton-Brush growth series; many were in their 60s and 70s when recalled. The following changes in the facial profiles of these untreated patients were found. (1) There was an increase in nasal projection. The nasal tip moved inferiorly. (2) Both lips became less prominent and tended to move inferiorly. The upper lip tended to move down and back, and this led to less exposure of the maxillary teeth. (3) The nasolabial angle became more acute. Essentially, Behrents found and described a clockwise rotation of the nasolabial complex.
Recently, there has been debate on both sides of the issue of where teeth should be left during adolescent treatment to compensate for these documented changes that occur in the aging face. The extraction-nonextraction debate is flourishing again. In 1994, Proffit looked at changes in the extraction rate over the previous 40-year period. He estimated that the extraction rates were 30% in 1953, 76% in 1968, and 28% in 1993. Sarver et al contended that teeth should be left in a forward position because of the changes that will occur to the face. Specifically, they stated, “First, in designing treatment for the adolescent, the orthodontist usually is the first professional to make decisions on how a patient will look for the rest of his or her life. For instance, anterior teeth that were retracted in adolescence to correct a protrusion, even though they looked good initially, may appear overretracted 20 years later. The experience in the 1950s and 1960s of high extraction rates and profile flattening has resulted in many unesthetic facial outcomes. For these patients, there is loss of lip thickness with aging which makes the lack of lip support from the teeth even more obvious.”
As a result of this expressed and valid concern, numerous published studies have documented changes in the soft tissue profile after both extraction and nonextraction orthodontic treatments. Luppanapornlarp and Johnston studied samples of “clear-cut” extraction and nonextraction patients. They found that the patients treated without extractions in fact had the flattest faces in their sample. Cloward went a step farther and studied the impact of 4 first premolar extractions on the facial profiles of patients with minimal crowding. As expected, Cloward found profile changes in those subjects. Zierhut et al determined that when the faces of a Class II Division 1 extraction treatment sample were compared with the faces of a Class II Division 1 nonextraction sample, they are similar. Even more interesting was that after 14 years, the faces in the sample of Zierhut et al, although they had flattened somewhat, remained similar. The changes were, therefore, maturational and had nothing to do with the extractions or the lack thereof.
This study was initiated to find some answers to these seemingly continual questions. It was completed in an attempt to help solve the controversy of what impact, if any, extractions have on the aging face.
Material and methods
A sample of 57 untreated subjects was selected from the Bolton-Brush study at Case Western Reserve University in Cleveland, Ohio. The search on the Bolton database focused on subjects who had cephalometric films taken between 10 and 17 years of age and again after 30 years of age. These age groups were selected in an attempt to match the 10- to 17-year posttreatment films of the extraction sample to the sample that had received no treatment. The sole inclusion criterion (aside from high-quality cephalometric films with discernible soft tissue profiles) was that no subject had received orthodontic treatment. Films were chosen consecutively until no more persons met the inclusion criterion. The subjects in the Bolton-Brush sample had Angle Class I, Class II, or Class III malocclusions. Each subject was included in the study because his or her facial profile at 10 to 17 years of age matched the posttreatment profiles of the patients in the treated sample.
A sample of 47 orthodontic patients was selected from a collection of files of patients who were recalled approximately 25 years after their premolar extraction treatment was completed. Of these patients, 31 had Angle Class II malocclusions, 15 had Angle Class I malocclusions, and 1 had an Angle Class III malocclusion. All treated patients had extractions before treatment to ameliorate crowding, reduce facial protrusion, facilitate Class II dentition correction, or accomplish a combination of any of these goals. The films were chosen consecutively until there were no more patients who met the criteria. To meet the inclusion criteria, the patient needed to have high-quality cephalometric films taken after treatment and again nearly 25 years later. As with the untreated sample films, all had to show good soft tissue definitions and contain all landmarks necessary for analysis. Films were chosen consecutively until there were no more patients who met the criteria. All patients in the treated sample had 4 teeth extracted before orthodontic treatment. The premolar extractions were in the following patterns: 4 first premolars, 4 second premolars, maxillary first premolars and mandibular second premolars, or 3 premolars and a badly decayed first molar. Most important is that all were treated in a private practice by the same clinician (J.L.V.), who had similar treatment objectives for all patients who were included in the sample.
Statistical analysis
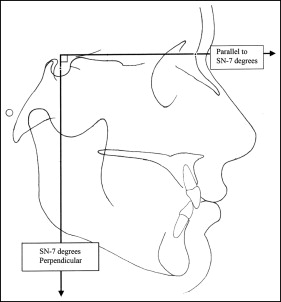
Hard and soft tissue anatomic landmarks initially established by Barnette were traced for each film. The landmarks were traced for the untreated and treated samples at both time points and then digitized using Dentofacial Planner software (version 7.0; Dentofacial Planner, Toronto, Ontario, Canada). In this software, 2 reference planes were constructed to create an x-y coordinate grid: a horizontal line was created level with nasion at an angle parallel to the sella-nasion line minus 7°, and a vertical line was created perpendicular to the parallel line to the sella-nasion line minus 7° passing through sella. These planes are shown in Figure 1 .
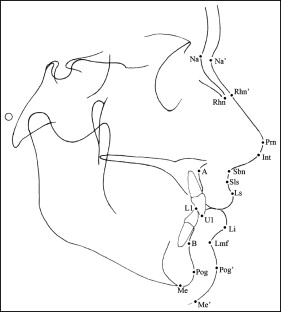
Descriptive data were obtained, and a statistical analysis was performed using the Statistical Package for the Social Sciences (version 18; SPSS, Chicago, Ill). Descriptive statistics and variable analyses were calculated for 14 landmarks. Facial measurements, soft tissue thicknesses, and soft tissue lengths were also analyzed ( Table I ). The landmarks used for this study are illustrated in Figure 2 . Independent t tests were performed with a set significance level of P <0.05 to appraise the changes in position of the 14 landmarks and to ascertain the changes in facial measurements, soft tissue thicknesses, and soft tissue lengths.
| Abbreviation | Cephalometric point |
|---|---|
| Na | Nasion |
| Na′ | Soft tissue nasion |
| Rhn | Rhinion |
| Rhn′ | Soft tissue rhinion |
| Prn | Pronasale |
| Int | Inferior nasal tip |
| Sbn | Subnasale |
| Sls | Superior labial sulcus |
| Ls | Labrale superius |
| Li | Labrale inferius |
| Lmf | Labiomental fold |
| Pog | Pogonion |
| Pog′ | Soft tissue pogonion |
| Me | Menton |
| Me′ | Soft tissue menton |
| A | A-point |
| B | B-point |
| U1 | Maxillary incisor tip |
| L1 | Mandibular incisor tip |
The percentages of enlargement were considered for both samples. Mellion had previously determined that specific films from the extraction group nearly 25 years after treatment had a reduction in magnification. This was due to the use of a different cephalostat and the consequent reduction in the object to film distance. All films from the Bolton study were produced with the Bolton cephalometric technique, in which there was a constant anode to object distance of 5 feet, and the object to film distance, also called the midline to lateral film distance, was kept to a minimum. The midline to lateral film value is therefore unique for each patient and also unique to each film. The midline to lateral film distance was recorded for each film traced and then converted to the percentage of enlargement from the Bolton standard technique. Once all enlargement values were identified, a conversion factor was found from the effect of distance from the subject to the film. All distances were adjusted to 0% enlargement (ie, life size). Microsoft Word and Excel from Microsoft Office (edition 2007; Microsoft, Redmond, Wash) were used for the construction of tables and graphs. Profile images detailing the soft tissue changes for the descriptive statistics of each sample were created using Adobe Illustrator (version CS11; Adobe, San Jose, Calif).
Results
The study was designed to determine whether there is a significant difference in the soft tissue facial profiles of adults who did not undergo orthodontic treatment compared with the profiles of patients who had extraction orthodontic treatment as teens. This study is relevant and important, particularly in our society that believes in nonextraction at all costs. We hope that it will give our specialty some useful and important information about the long-term impact of extraction treatment on the facial profile. Independent t test comparisons between the untreated and extraction-treated samples at posttreatment and recall are shown in Table II . The differences were significant for horizontal and vertical pronasale, horizontal and vertical inferior nasal tip, vertical superior labial sulcus, vertical labrale superius, vertical labrale inferius, vertical labiomental fold, vertical soft tissue pogonion, vertical soft tissue menton, horizontal and vertical A-point, vertical mandibular incisor tip, vertical B-point, vertical pogonion, and vertical menton. For all landmarks that had significance, the changes were greater in the untreated sample, but the direction of change was more horizontal than vertical in the treated sample.
| Measurement | Untreated, mean ± SD (mm) | Extraction-treated, mean ± SD (mm) | t | Significance (2-tailed) |
|---|---|---|---|---|
| x Prn | 7.62 ± 5.38 | 4.32 ± 5.28 | 3.16 | 0.002 ∗ |
| y Prn | 1.74 ± 5.15 | −1.13 ± 4.45 | 3.06 | 0.003 ∗ |
| x Int | 7.31 ± 5.50 | 4.42 ± 5.64 | 2.64 | 0.010 ∗ |
| y Int | 2.14 ± 5.09 | −0.08 ± 4.00 | 3.36 | 0.001 ∗ |
| x Sls | 5.68 ± 5.67 | 3.39 ± 7.39 | 1.33 | 0.187 |
| y Sls | 3.61 ± 4.92 | 1.19 ± 3.86 | 2.83 | 0.006 ∗ |
| x Ls | 4.88 ± 6.53 | 3.80 ± 8.28 | 0.75 | 0.468 |
| y Ls | 5.27 ± 5.18 | 1.86 ± 3.76 | 3.90 | 0.000 ∗ |
| x Li | 8.45 ± 7.17 | 3.38 ± 9.32 | 1.25 | 0.214 |
| y Li | 1.47 ± 5.95 | −1.92 ± 4.06 | 3.45 | 0.001 ∗ |
| x Lmf | 9.96 ± 7.96 | 8.57 ± 10.03 | 0.78 | 0.439 |
| y Lmf | 4.69 ± 5.90 | 0.03 ± 4.78 | 4.48 | 0.000 ∗ |
| x Pog′ | 11.62 ± 9.08 | 11.13 ± 11.45 | 0.24 | 0.813 |
| y Pog′ | 6.38 ± 6.53 | 1.83 ± 5.44 | 3.89 | 0.000 ∗ |
| x Me′ | 11.62 ± 10.16 | 12.67 ± 12.20 | −0.45 | 0.657 |
| y Me′ | 7.42 ± 7.18 | 1.05 ± 4.41 | 5.58 | 0.000 ∗ |
| x A-point | 7.20 ± 5.23 | 4.50 ± 6.54 | 2.30 | 0.024 ∗ |
| y A-point | 2.53 ± 4.62 | 0.22 ± 3.42 | 2.95 | 0.004 ∗ |
| x U1 | 8.21 ± 6.44 | 6.86 ± 9.21 | 0.89 | 0.396 |
| y U1 | 1.99 ± 4.80 | 0.49 ± 3.21 | 1.92 | 0.058 |
| x L1 | 7.79 ± 6.30 | 6.23 ± 8.93 | 1.02 | 0.311 |
| y L1 | 2.53 ± 5.00 | −0.69 ± 3.54 | 3.87 | 0.000 ∗ |
| x B-point | 8.68 ± 7.82 | 8.26 ± 10.27 | 0.23 | 0.820 |
| y B-point | 3.16 ± 5.76 | −0.12 ± 4.34 | 3.32 | 0.001 ∗ |
| x Pog | 10.38 ± 8.77 | 10.05 ± 11.77 | 0.16 | 0.872 |
| y Pog | 5.19 ± 6.72 | 0.65 ± 4.34 | 4.18 | 0.000 ∗ |
| x Me | 10.48 ± 9.25 | 10.49 ± 12.24 | 0.00 | 1.000 |
| y Me | 5.62 ± 6.88 | 1.09 ± 4.42 | 4.09 | 0.000 ∗ |
Independent t tests were performed to ascertain the significant differences between posttreatment and recall for the untreated and the extraction-treated samples. Results for facial measurements, soft tissue thicknesses, and soft tissue lengths are given in Tables III-V . For the facial measurements ( Table III ), the changes in hard tissue facial angle, nasolabial angle, mentolabial fold, and upper and lower anterior facial height were significantly different. The hard tissue facial convexity angle changed more in the extraction-treated sample and became less convex. The nasolabial angle and the mentolabial angle changed more in the untreated sample and became less convex. The upper and lower anterior facial heights changed more in the untreated sample and became larger. Soft tissue thickness differences ( Table IV ) between posttreatment and recall were compared. Rhinion and B-point in the untreated sample changed more and became thicker than in the extraction-treated sample. Soft tissue length ( Table V ) changed significantly over the time interval studied. Upper and lower lips and nose lengths changed significantly more in the untreated sample than in the extraction-treated sample.


