Introduction
The aim of this study was to assess the changes in inclination of the maxillary second (M2) and third (M3) molars after orthodontic treatment of Class II Division 1 malocclusion with extraction of maxillary first molars.
Methods
Two groups of subjects were studied. The experimental group consisted of 37 subjects, 18 boys and 19 girls (mean age, 13.2 ± 1.62 years). The inclusion criteria were white origin, Class II Division 1 malocclusion, overjet ≥4 mm, no missing teeth or agenesis, and maxillary M3 present. All patients were treated with extraction of the maxillary first molars and the Begg technique. Standardized lateral cephalometric radiographs were taken at the start of active treatment (T1) and at least 3.7 years posttreatment (T2). The control group was drawn from the archives of the Nittedal Growth Material (Oslo University, Oslo, Norway) and included 54 untreated Class I and Class II subjects,18 boys and 36 girls (mean age, 13.4 ± 1.99 years) followed up for a minimum of 3.6 years. M2 and M3 inclinations relative to the palatal plane (PP) and functional occlusal plane (FOP) were measured and compared between groups and time periods.
Results
M2 to PP inclination improved significantly in both the control group (M2-PP at T1, 17.7° ± 5.81°, and at T2, 11.9° ± 4.61°) and the experimental group (M2-PP at T1, 26.7° ± 5.75°, and at T2, 6.9° ± 6.76°). There were also significant increases of the mesial inclination of M3 in the control group (M3-PP at T1, 30.1° ± 8.54°, and at T2, 19.6° ± 9.01°) and extraction group (M3-PP at T1, 32.2° ± 7.90°, and at T2, 12.8° ± 7.36°). By using the FOP as the reference system, no significant change in the inclination of M2 was observed in the control group, whereas, in the extraction group, although more distally inclined at T1, M2 ended up mesially inclined at T2 (M2-FOP at T1, 14.2° ± 4.62°, and at T2, −6.2° ± 6.10°; P <0.0001). M3 inclinations were similar between the groups at T1 (M3-FOP control, 17.3° ± 9.35°; M3-FOP experimental, 19.6° ± 7.37°), and these improved significantly in both groups. However, M3 uprighting was almost 4 times greater in the extraction group (M3-FOP from T2-T1, 5.6° vs 19.9°). The greatest distal inclination of M3 at T2 in the extraction group was 9.4°, a value attained by only 43% of the control group.
Conclusions
Extraction of the maxillary first molars in Class II Division 1 patients results in significant uprighting of M2 and M3 and facilitates the normal eruption of M3.
Extraction of the maxillary first permanent molars (M1s) is an available treatment option for patients with Class II malocclusion with an increased overjet and a fairly well-aligned mandibular arch. Indications can include teeth affected by caries or periodontitis, with extensive restorations and questionable long-term prognoses. It is still controversial whether high-angle patients would benefit from extractions in the posterior part of the buccal segments. It is also argued that the particular extraction pattern will have a less flattening effect on the facial profile. In addition to this, extracting posterior teeth can be advantageous with regard to the inclination of the third molars.
A recent study of Class II Division 1 patients treated with extraction of the M1s and fixed appliances demonstrated good treatment outcomes with minor retrusive effects on the facial profiles. These investigators could not attribute to this treatment method a clinically significant bite-closing effect. Boij et al termed this treatment modality a “less-compliance therapy” underlying the relatively diminished dependence on patient cooperation.
So far, few authors have investigated third molar changes after tooth extractions, solely or combined with orthodontic treatment. Most of them dealt with second molar extractions, first premolar extractions (in the maxillary arch, or the maxillary and mandibular arches ), or unilateral extractions of the mandibular first molar. In the single study that evaluated the extraction of all 4 first permanent molars, a favorable effect on the inclination of third molars was documented. The aim of this study was to assess the change of inclination of maxillary second (M2s) and third (M3s) molars after orthodontic treatment of Class II Division 1 malocclusion with extraction of the M1s.
Material and methods
The study group consisted of 37 subjects (18 boys, 19 girls; mean age, 13.2 years; SD, 1.62 years) consecutively treated with the Begg technique by 1 orthodontist (J.W.B.). The inclusion criteria for the initial enrollment were white patients, with Class II Division 1 malocclusion, sagittal overjet of ≥4 mm, treatment plan including extraction of the M1s, no missing teeth or agenesis, M3s present, and 1-stage full fixed appliance treatment. Standardized lateral cephalometric radiographs on the same radiographic unit (Trophy OL 100, Trophy Radiologie, Vincennes, France) were available at the start of active treatment (T1) and at least 3.7 years posttreatment (T2).
The control group consisted of untreated Class I and Class II subjects (18 boys, 36 girls; mean age, 13.4 years; SD, 1.99 years) followed for a minimum of 3.6 years. The subjects were drawn from the archives of the Nittedal Growth Material, a longitudinal study conducted by the Department of Orthodontics, University of Oslo, Oslo, Norway, and described in detail in previous articles. The data were collected within a 20-year period from children called for dental examination at 6 years and then every 3 years until the age of 21. Radiographic records of poor quality were excluded from the study material. Table I shows the means and standard deviations for the ages and observation periods for all groups.
| Group | n | Age (y) | Observation period T2-T1 (y) | ||
|---|---|---|---|---|---|
| Mean | SD | Mean | SD | ||
| Experimental (boys) | 18 | 13.2 | 1.27 | 5.0 | 1.00 |
| Experimental (girls) | 19 | 13.1 | 1.93 | 4.9 | 1.18 |
| Control (boys) | 18 | 13.4 | 2.11 | 5.9 | 2.32 |
| Control (girls) | 36 | 13.4 | 1.96 | 5.4 | 1.80 |
All lateral headfilms were scanned and digitized by 1 investigator (C.L.) using cephalometric analysis software (Viewbox 3.0; dHAL Software, Kifissia, Greece).
The landmarks traced on each lateral headfilm are summarized in Figure 1 .
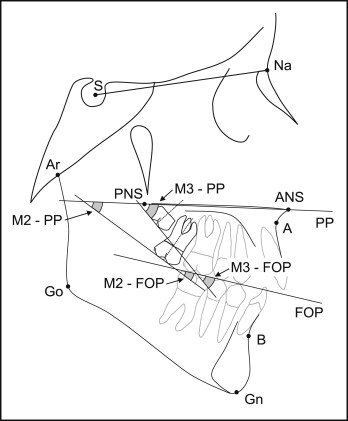
A number of skeletal and dental points were digitized for the definition of measurements necessary to evaluate the subjects’ molar inclinations and craniofacial patterns.
Molar inclination was assessed by the following angles ( Fig 1 ): M2-PP the angle between the occlusal surface of M2 and the palatal plane; M2-FOP, the angle between the occlusal surface of M2 and the functional occlusal plane; M3-PP: the angle between the occlusal surface of M3 and the PP; and M3-FOP: the angle between the occlusal surface of the M3 and the FOP.
The occlusal surface of each molar was constructed with a line passing through the midpoint of the occlusal surface perpendicular to the long axis. The latter was defined as a line joining the midpoints of the occlusal surface and the apical area of the molar. When the outline of the roots was not discernible, the midpoint of the cervix was marked instead. Hence, positive molar angles signified distal molar inclination,s and negative angles signified mesial inclinations.
In addition to the angles related to inclination of the molars, 6 skeletal angular measurements (SNA, SNB, ANB, PP to SN, PP to MP, and Ar-Go-Gn) were included in the cephalometric analysis.
Statistical analysis
The data were analyzed with the StatsDirect statistical software (version 2.7.2; StatsDirect, Cheshire, United Kingdom). Nonparametric tests were performed to evaluate the changes between T1 and T2. The reproducibility of the measurements was assessed by statistical analyses of the differences between double measurements of 20 randomly selected and traced radiographs by the same investigator 2 weeks after the initial series of measurements.
Results
Random errors were calculated according to the method of Houston. Errors ranged from 3.21° (M2-PP) to 4.78° (M3-PP). Paired t tests did not show any systematic error between the 2 measurements ( P >0.05).
The measurements were tested for normality of distribution and equality of variance (F test). For some variables, the F test was significant; therefore, it was decided to apply more robust nonparametric methods (Mann-Whitney and Wilcoxon signed rank tests) for intergroup comparisons.
Comparison of T1 skeletal values of the control and experimental boys showed significant differences for the angles SNB, ANB, and PP-MP. The female groups had significant differences in the angular measurements ANB, PP-SN, PP-MP, and Ar-Go-Gn. It generally seemed that the experimental subjects were more retrognathic and hyperdivergent than were the controls ( Table II ).
| Measurement | Boys | Girls | ||||
|---|---|---|---|---|---|---|
| Ctrl (n = 18) | Exp (n = 18) | 95% CI | Ctrl (n = 19) | Exp (n = 36) | 95% CI | |
| SNA (°) | 83.7 (2.53) | 81.1 (4.47) | −6.29 to −2.14 | 82.2 (3.47) | 83.6 (4.47) | −0.58 to 3.40 |
| SNB (°) | 80.3 (2.54) | 76.0 (3.84) | −4.97 to 0.21 ‡ | 78.2 (2.53) | 77.2 (4.17) | −3.85 to 0.84 |
| ANB (°) | 3.3 (3.02) | 5.2 (1.94) | 0.03 to 3.66 ∗ | 4.0 (2.04) | 6.3 (2.11) | −3.54 to −1.26 ‡ |
| PP-SN (°) | 8.2 (3.70) | 6.7 (4.13) | 4.67 to 1.01 | 8.1 (3.01) | 5.9 (3.52) | 0.16 to 4.08 ∗ |
| PP-MP (°) | 19.8 (6.39) | 26.2 (2.81) | 3.53 to 10.27 † | 20.7 (4.11) | 26.9 (4.80) | −8.85 to −3.73 ‡ |
| Ar-Go-Gn (°) | 125.6 (5.90) | 124.5 (6.26) | −4.99 to 2.69 | 124.1 (5.36) | 125.4 (4.03) | −4.32 to 1.25 ∗ |
The average molar angular values and standard deviations of the experimental and control groups are presented in Table III . There were statistically significant differences in the angles M2-PP and M2-FOP for the experimental and control groups for both sexes at T1. The measurements for the M3s between groups at T1 did not differ significantly. However, all groups showed significant differences in all measurements at T2.
| Measurement | Boys | Girls | ||||
|---|---|---|---|---|---|---|
| T1 | Ctrl (n = 18) | Exp (n = 18) | 95% CI | Ctrl (n = 36) | Exp (n = 19) | 95% CI |
| M2-PP | 17.1 (7.13) | 26.5 (5.15) | 4.33 to 13.67 ‡ | 18.1 (5.12) | 27.0 (6.40) | 5.62 to 12.68 ‡ |
| M2-FOP | 4.4 (5.99) | 14.4 (4.77) | 6.37 to 13.57 ‡ | 5.2 (5.96) | 13.9 (4.58) | 5.66 to 12.34 ‡ |
| M3-PP | 29.6 (7.87) | 32.5 (8.57) | −2.27 to 8.92 | 30.3 (8.94) | 31.8 (7.42) | 3.09 to 6.37 |
| M3-FOP | 16.9 (7.13) | 20.5 (8.31) | −2.76 to 9.64 | 17.5 (9.94) | 18.8 (6.48) | −2.46 to 5.18 |
| T2 | Ctrl (n = 18) | Exp (n = 18) | 95% CI | Ctrl (n = 36) | Exp (n = 19) | 95% CI |
|---|---|---|---|---|---|---|
| M2-PP | 11.4 (5.16) | 6.2 (5.99) | −8.75 to −1.87 † | 12.1 (4.37) | 7.6 (7.51) | −7.20 to −0.87 ∗ |
| M2-FOP | 2.7 (4.35) | −5.2 (5.06) | −10.90 to −4.22 ‡ | 4.5 (4.71) | −7.1 (6.96) | −14.12 to −8.30 ‡ |
| M3-PP | 19.6 (9.70) | 11.2 (6.73) | −13.16 to −2.38 † | 19.7 (8.79) | 14.3 (7.79) | −10.66 to −0.83 ∗ |
| M3-FOP | 10.9 (11.28) | −0.2 (6.54) | −16.13 to −4.88 ‡ | 12.1 (10.01) | −0.4 (7.19) | −17.87 to −7.99 ‡ |
Stay updated, free dental videos. Join our Telegram channel
VIDEdental - Online dental courses


