Introduction
The aim of this study was to investigate the expert panel methodology applied in orthodontics and its reporting quality. Additionally, the relationship between the reporting quality and a range of variables was explored.
Methods
PubMed was searched for orthodontic studies in which the final diagnosis or assessment was made by 2 or more experts published up to March 16, 2015. Reporting quality assessment was conducted using an established modified checklist. The relationship between potential predictors and the total score was assessed using univariable linear regression.
Results
We identified 237 studies with a mean score of 9.97 (SD, 1.12) out of a maximum of 15. Critical information about panel methodology was missing in all studies. The panel composition differed substantially across studies, ranging from 2 to 646 panel members, with large variations in the expertise represented. Only 17 studies (7.2%) reported sample size calculations to justify the panel size. Panel members were partly blinded in 65 (27.4%) studies. Most studies failed to report which statistic was used to compute intrarater (65.8%) and interrater (66.2%) agreements. Journal type (nonorthodontic: β, 0.23; 95% CI, −0.07 to 0.54 compared with orthodontic), publication year (β, 0; 95% CI, −0.02 to 0.02 for each additional year), number of authors (1-3: β, 0.30; 95% CI, −0.13 to 0.74 compared with at least 6; 4-5: β, 0.18; 95% CI, −0.29 to 0.33 compared with at least 6), and number of centers involved (single: β, 0.20; 95% CI, −0.14 to 0.54 compared with multicenter) were not significant predictors of improved reporting. Studies published in Asia and Australia had significantly lower scores compared with those published in Europe (β, −0.54; 95% CI, −0.92 to −0.17).
Conclusions
Formal guidelines on methodology and reporting of studies involving expert panels are required.
Highlights
- •
Methods of expert panel diagnosis vary across orthodontic studies and aspects of the procedure are either unclear or unreported.
- •
Poor reporting hinders the reliability assessment of outcomes determined by expert panels.
- •
Complete description of the methods used for panel assessments should be reported.
- •
Establishing standards of reporting panel methodology needs to be emphasized.
Orthodontic studies in which, for example, validity of occlusal indexes or dentofacial esthetics is investigated face the key challenge of attempting to measure in participants objectively subjective constructs. In those situations, an error-free method of assessment would be ideal. However, an orthodontic anomaly is not a disease with a series of well-recognized symptoms, but a variation from the norm where treatment is based on certain dentofacial characteristics in an otherwise healthy patient. Therefore, despite all efforts, no precise and clinically meaningful definition of malocclusion exists. This notion introduces an element of subjectivity and uncertainty from diagnosis to final treatment outcome evaluation.
(orthodont*) AND ((diagnosis) OR (decision) OR (judgment) OR (assessment) OR (evaluation) OR (rating)) AND ((panel) OR (expert panel) OR (raters) OR (judges) OR (evaluators) OR (assessors) OR (consensus decision) OR (consensus diagnosis) OR (consensus methods)) AND (English[lang]).
In this general framework, orthodontists vary substantially in their observations, perceptions, and reasoning when determining appropriate orthodontic care. Patients’ occlusions and esthetic characteristics are judged before and after treatment inconsistently. One strategy to overcome this lack of objectivity is the use of expert or professional panels, in which a group of experts determines the final patient diagnosis on the basis of available relevant data.
This variation in practice patterns can question the quality of clinical decision making. The panel’s subjectivity in assessing conditions lacking precise and objective definitions and the inherent disadvantages of various types of rating scales used for this purpose can also introduce errors in study results. In addition, incomplete reporting of panel methodology hinders critical appraisal of articles and replication of studies. The use of guidelines to improve the completeness of reporting in health research has been widely discussed and encouraged in the literature. The positive impact of endorsement of such guidelines has been established, and the need for increased awareness of them has been highlighted by inadequate reporting in leading orthodontic journals.
A recent systematic review on the methodology of panel diagnosis in various medical specialties indicated that the published methods vary substantially and that reporting of this methodology is often unclear or absent. Based on their findings, the authors provided a checklist to guide the conduct and reporting of studies involving expert panels. However, potential predictors of improved reporting were not explored. Study characteristics such as journal of publication, year and continent of publication, number of authors, and single or multicenter involvement have previously been related to reporting quality. Possible contributions of several investigators and centers might improve the quality of studies that are meticulously planned and conducted. In addition, the completeness and accuracy of reporting may improve with editorials, and reviewers’ and authors’ adherence to strict reporting guidelines. Scoping searches of the orthodontic literature showed the scarcity of reviews assessing expert panel methodology and reporting, although such panels have been widely used.
Although the rationale for developing objective measures from prior subjective evaluations by a panel of experts is essential in the orthodontic literature, it seems necessary to standardize the construction of these panels to better serve their purpose. Guideline development is an evolving area, according to which various initiatives have been promoted to improve the completeness, quality, and transparency of research. Transparent reporting of expert panel methodology would enable better justification of orthodontic diagnosis and treatment decisions. This would improve the quality of orthodontic care and reduce variation and inconsistency in orthodontic diagnosis and treatment.
The primary purpose of this methodologic review was to describe the variations in methods applied in published studies using an expert panel assessing patients’ characteristics irrespective of age, sex, treatment modality, and treatment stage. Not only orthodontic journals but also scientific journals of other disciplines were considered. Secondarily, the quality of reporting of the methods used in these studies was assessed, and its association with a range of variables was explored.
Material and methods
Studies had to meet the following criteria to be included in the analysis.
- 1.
Study design. Any study design in orthodontics involving an expert panel to define the reference standard. Case reports were excluded.
- 2.
Participants. Human subjects irrespective of age, sex, and ethnicity who had any kind of intervention: ie, orthodontic, orthognathic, and so on.
- 3.
Interventions. The reference standard used was based on the perceptions of multiple experts (2 or more) in making a final diagnosis or assessment. Dental students and orthodontic residents were not considered to be experts. However, studies with a mixed panel including orthodontists and undergraduate or postgraduate students were considered eligible for inclusion. All types of rating scales administered by expert panels to determine any kind of target condition were included.
- 4.
Outcomes. Any primary or secondary outcome measure that required expert panel involvement in their assessment.
- 5.
Timing. Expert panels used to make assessments at any stage of treatment; before, during, or after treatment.
- 6.
Setting. Patients treated in any type of setting: private clinics, university clinics, and so on.
Studies including a panel to evaluate current evidence on a topic or to provide recommendations and guidelines, and research evaluating errors in landmark identification on cephalograms were beyond the scope of this review.
Information sources, search strategy, and study selection
A PubMed search for articles using expert panels or consensus methods was performed from 1980 to March 16, 2015, by an author (E.L.).
The search was limited to studies written in English. Hand searches of the reference lists of the retrieved articles for full-text assessment were also conducted. The reviewers were not blinded with regard to author identity and origin of the study. Titles and abstracts from the articles retrieved by the database search were screened for eligibility twice and were selected by 1 reviewer (E.L.)
Reliability assessment
From the included articles, 50% were randomly selected to be scored independently by 2 reviewers (E.L., E.T.), and interrater agreement was calculated. The remaining 50% of the articles were scored by only 1 investigator (E.L.). To arrive at a consensus, discrepancies between the 2 reviewers were resolved by discussion. To test intrarater reproducibility, 10% of the articles were reassessed by the 2 reviewers 6 weeks after the initial evaluation.
Data items and collection
Study details were collected using a predetermined form similar to that proposed by Bertens et al. Information on the following domains was recorded: study aim, target measure, panel composition, process of decision making, available information for the panel, blinding, and validity of the panel’s diagnosis ( Appendix ). In addition, information on number of authors, region of authorship, number of centers involved, and justification of the number of experts in the panels with the sample size calculation was recorded. Two authors (E.L., E.T.) underwent a 3-stage calibration procedure before the data acquisition phase. Stage 1 involved study of the article of Bertens et al and discussion of the proposed items. Ten randomly selected articles were scored independently in stage 2. Stage 3 involved discussion of the results of the first scoring session. Modifications were made to the scoring procedures before beginning full data collection.
Quality assessment
The modified checklist comprised questions related to the following 5 key domains suggested to be related to completeness of the reporting score for panel constitution, information presentation, decision process, agreement testing, and face validity (credibility) of panel diagnosis.
The score per domain ranged from 1 to 3, with a score of 1 indicating no description, 2 representing inadequate description, and 3 reflecting adequate description. To assign a score from 1 to 3, different items were assessed that were grouped together composing those 5 key domains. If at least 1 item was unreported, this was interpreted as an inadequate description for the relevant domain. The scores for the 5 domains were combined, and a total score was calculated for each study. The maximum score for a study with adequate descriptions for all items was 15.
Statistical analysis
Frequency distributions of study characteristics and total scores were calculated. Univariable linear regression was undertaken to determine the effect of characteristics including journal, region of authorship, year of publication, number of authors, and number of centers on the final scores. The use of linear regression was justified based on the large sample size and because the dependent variable representing the final score had a distribution close to normal. For each item, interexaminer and intraexaminer agreements were evaluated with kappa statistics. The level of statistical significance for all tests was prespecified at 0.05. Statistical analyses were performed with STATA software (version 13.1; StataCorp, College Station, Tex).
Results
Interexaminer agreement ranged from kappa scores of 0.41 to 1, indicating moderate to perfect agreement. The kappa values calculated for intraexaminer reliability ranged from 0.60 to 1 and from 0.54 to 1 for each reviewer, indicating moderate to perfect agreement. The lowest kappa scores for interexaminer and intraexaminer agreements were reported for the item describing limitations or strengths of panel diagnosis ( Table I ).
| Item | Number of studies | Percentage of studies | Interater agreement | Intrarater agreement reviewer 1 | Intrarater agreement reviewer 2 |
|---|---|---|---|---|---|
| Panel composition | |||||
| Number of panels | 237 | 100% | 0.80 | 0.94 | 1 |
| Number of panel members/experts | 235 | 99.2% | 1 | 0.90 | 1 |
| Is that number justified with sample size calculations? | 17 | 7.2% | 0.87 | 1 | 0.80 |
| Fields of expertise | 229 | 96.6% | 1 | 1 | 1 |
| Years of experience | 47 | 19.8% | 0.80 | 1 | 0.81 |
| Information available for panel diagnosis | |||||
| Sources of information | 237 | 100% | 1 | 0.90 | 0.70 |
| Was original/raw data available? | 237 | 100% | 0.81 | 0.88 | 1 |
| Blinding | 65 | 27.4% | 0.60 | 0.89 | 1 |
| Methods of decision making | |||||
| Subjects assessed by experts (n) | 234 | 98.7% | 0.91 | 0.86 | 1 |
| Selected subgroups withheld from panel assessment | 237 | 100% | 0.87 | 1 | 1 |
| Prespecified decision rule | 1 of 5 | 20% | 0.97 | 1 | 1 |
| Classification of the target condition | 237 | 100% | 0.89 | 0.73 | 0.84 |
| Probability estimations | 1 | 0.4% | 0.92 | 1 | 1 |
| Individual or plenary decision process | 237 | 100% | 0.98 | 1 | 1 |
| Handling of disagreements | 12 | 5.1% | 0.92 | 1 | 1 |
| Agreement testing | |||||
| Reproducibility of plenary decision process or intrarater agreement | 81 | 34.2% | 0.74 | 0.90 | 1 |
| Details of intrarater agreement testing (timeline, double assessments) | 74 of 81 | 91.4% | 0.74 | 0.90 | 1 |
| Interrater agreement (internal consistency) | 80 | 33.8% | 0.75 | 0.90 | 1 |
| Interpanel agreement | 25 of 113 | 22.1% | 0.67 | 0.79 | 1 |
| Face validity | |||||
| Why was gold standard not used? | 32 (13.5%) | 13.5% | 0.71 | 0.65 | 1 |
| Approaches supplementary to expert diagnosis (ie, nonexpert panel) to “check” final diagnosis? | 111 | 46.8% | 0.79 | 0.91 | 0.80 |
| Used (theoretical) references | 187 | 78.9% | 0.80 | 0.86 | 0.78 |
| Limitations/strengths of panel diagnosis according to authors | 151 | 63.7% | 0.41 | 0.60 | 0.54 |
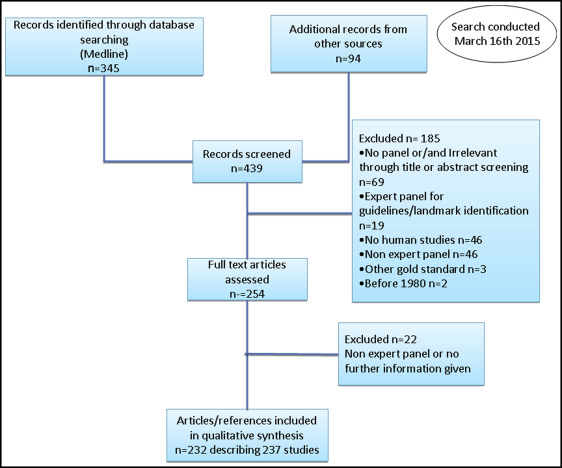
The electronic search yielded 345 potentially eligible articles on March 16, 2015. Applying the inclusion criteria to the full texts resulted in 166 articles ( Fig ). Hand searching of the reference lists of the retrieved full-text publications identified 66 additional articles for inclusion. Four of those 232 articles described 9 different studies with an expert panel, and thus the final number of included studies reached 237. Characteristics of all 237 orthodontic studies by journal, region of authorship, number of authors, and number of involved centers are given in Table II . The mean total score across all studies was 9.97 (SD, 1.12; range, 8-14).
| Trial characteristic | Category | n | Mean | SD | 95% CI |
|---|---|---|---|---|---|
| Journal | Orthodontic | 161 | 9.9 | 1.12 | 9.73-10.07 |
| Other (surgery/medicine other dentistry fields) | 76 | 10.13 | 1.10 | 9.88-10.38 | |
| Continent | Europe | 89 | 10.19 | 1.05 | 9.97-10.41 |
| Americas | 94 | 9.96 | 1.28 | 9.70-10.22 | |
| Asia/other | 54 | 9.65 | 0.80 | 9.44-9.86 | |
| Number of authors | 1-3 | 88 | 9.92 | 0.97 | 9.72-10.12 |
| 4-5 | 113 | 9.94 | 1.20 | 9.72-10.16 | |
| ≥6 | 36 | 10.22 | 1.15 | 9.84-10.6 | |
| Number of centers | Single center | 182 | 9.93 | 1.11 | 9.77-10.09 |
| Multicenter | 55 | 10.13 | 1.12 | 9.83-10.43 |
Expert panels were found to be common in the orthodontic literature most often considering various aspects of esthetics or attractiveness (165 of 237 studies, 69.6%) either prospectively or retrospectively ( Table III ). The median number of patients undergoing panel assessment was 42, with a range from 1 to 1306 patients.
| Study aim | Frequency | % | Target measure | Frequency | % |
|---|---|---|---|---|---|
| Comparing perceptions of different panels | 64 | 27% | Esthetics only | ||
| Profile | 45 | 19% | |||
| Facial | 43 | 18.1% | |||
| Smile | 33 | 13.9% | |||
| Dental | 17 | 7.2% | |||
| Nasolabial | 12 | 5.1% | |||
| Dentofacial | 7 | 3% | |||
| Nasal | 6 | 2.5% | |||
| Labial | 2 | 0.8% | |||
| Assessing accuracy (validity, reliability) of at least 1 assessing tools | 44 | 18.6% | Esthetics and function or treatment need | 3 | 1.3% |
| Correlating objective with subjective assessments | 34 | 14.4% | Treatment need | 20 | 8.4% |
| Comparing outcome of different treatment modalities | 22 | 9.3% | Treatment decision | 11 | 4.6% |
| Testing performance of imaging software | 13 | 5.5% | Occlusion/malocclusion | 10 | 4.2% |
| Defining levels of professional agreement | 11 | 4.6% | Overall treatment outcome | 5 | 2.1% |
| Developing an assessing method | 10 | 4.2% | Decalcification | 3 | 1.3% |
| Other | 39 | 16.5% | Other | 20 | 8.4% |
| Total | 237 | 100% | Total | 237 | 100% |
Table I displays the proportion of studies that reported on different items related to panel makeup, information available for panel evaluation, methods of decision making, agreement testing, and face validity. In general, incomplete reporting was a common finding: information on panel composition was missing in 231 (97.5%) studies, details of information presented to the panel were inadequate in 172 (72.6%) studies, information about the decision process by the panel was incomplete in 236 (99.6%) studies, and information on agreement testing was missing in 112 (47.3%) studies and inadequate in 87 (36.7%) studies. Details on face validity were typically either missing (30 studies, 12.7%) or inadequate (181 studies, 76.4%).
In the majority of studies (124, 52.3%), 1 expert panel was used, whereas in the remaining studies the number of panels did not exceed 6. In 6 of those 113 studies with more than 1 panel, the same type of expertise (orthodontist) was represented in each panel. Mixed panels (eg, panels with experts and students or laypeople) were used in 50 studies. The median number of members in expert panels was 14 with a range of 2 to 646. Multiple fields of expertise of the panel members were represented in 95 (40.1%) studies with a maximum of 10 different fields of expertise. Forty different combinations of various experts were found. Table IV shows the distribution frequency of different fields of expertise reported in the included studies. There was a broad expert panel—the expert panel included dentists and other professionals—in 68 studies (28.7%). The reported years of experience in 47 studies (19.8%) ranged from 1 to 39. Generally, there was heterogeneity in the statistical means used to describe years of experience (mean years, ranges, standard deviations, combinations). Twenty-four of those 47 studies (51%), accounting for years of experience reported only the minimum years. In 8 studies (3.4%), terms such as “professionals,” “clinicians,” or “practitioners” were used to describe the panel members. Yet little or no information about expertise and years of experience and familiarity with the target measure or population of interest was given.
| Field of expertise | Frequency | % | |
|---|---|---|---|
| General terms used to describe fields of expertise | Other terms used to describe fields of expertise | ||
| Orthodontist | Consultant orthodontist | 212 | 89.5% |
| Dental specialist | Prosthodontist, periodontist, endodontist, oral and maxillofacial radiologist (or oral radiologist or radiologist), pedodontist (or pediatric dentist), bruxism expert, TMD and occlusion expert | 10 | 4.2% |
| Surgeon | Oral surgeon, plastic surgeon, dental surgeon, maxillofacial surgeon, oral and maxillofacial surgeon, cleft surgeon, orthognathic surgeon | 56 | 23.6% |
| General dentist | Dentist, public health dentist, general dental practitioner, community dentist | 35 | 14.8% |
| Medical experts | Cleft physician | 1 | 0.4% |
| Pathologist | 2 | 0.8% | |
| Medical doctor | 1 | 0.4% | |
| Geneticist | 1 | 0.4% | |
| Pediatrician | 1 | 0.4% | |
| Pediatric otolaryngologist | 1 | 0.4% | |
| Professional/practitioner, clinician | 9 | 3.8% | |
| Member of plastic unit | 2 | 0.8% | |
| Hospital staff member | Dental staff | 3 | 1.3% |
| Members of dental practice board | 1 | 0.4% | |
| Varying familiarity from medical area | 2 | 0.8% | |
| Assistant | Dental assistant | 2 | 0.8% |
| Nurse | Dental nurse | 2 | 0.8% |
| Speech pathologist | 1 | 0.4% | |
| Laboratory technician | 1 | 0.4% | |
| Psychologist | Background in investigating psychology | 3 | 1.3% |
| Social worker | 1 | 0.4% | |
| Artist | Fine arts student, art student, visual artist, sculptor | 12 | 5.1% |
| Beautician | 1 | 0.4% | |
| Modeling agency employee | 1 | 0.4% |
Photographs were used by the panel in 169 of the 237 studies either alone (147, 62%) or combined with 1 (10, 4.2%), 2 (6, 2.5%), or 3 (6, 2.5%) other diagnostic tools. Dental casts alone were also frequently used (37 of 237 studies, 15.6%). Conventional 2-dimensional and 3-dimensional imaging were each used for evaluation by the panel in 3% of the studies.
In 91 of the 237 (38.4%) studies, there were notes available or information presented to the panelists not in their original (raw) form, such as original radiographic images, but as tracings, silhouettes, or digitally altered photographs. In 65 studies (27.4%), panel members were blinded to some source of information. Seven of these 65 studies (10.8%) used staged unblinding, in which the diagnosis was assigned twice by the panel, first on all diagnostic records except 1 and later on all diagnostic records.
In about half of the studies (119 of 237, 50.2%), multiple categories for disease classification were used, with a maximum of 11 categories. In 68 studies (28.7%), continuous scales were used, such as a visual analog scale. Ranking or selection were used as an assessment method in 20 studies (8.4%). Group meetings were used in 4 studies. In all studies except 1, the method of decision making by the panel was the individual; only in 12 (5.1%) studies, information was provided on how disagreements were handled across the panel members. Only 1 article reported on estimated certainty for reaching a decision. In 5 of 237 studies (2.1%), only a subgroup of patients was assessed by the entire panel. A random method to select such subgroups of patients was reported in only 1 study.
Table I shows the distribution of studies reporting interrater and intrarater agreements with measures of agreement, such as kappa statistics, intraclass correlation coefficients, Spearman correlation coefficients, or agreement percentages. Two methods were used to estimate intrarater reliability of an assessing method. The judges repeated the assessing procedure after a certain period up to 9 months, or in 1 session some records were assessed twice (25 studies).
Findings about the completeness of face validity reporting are shown in Table I .
The univariable regression analysis indicated that journal type ( P = 0.14), year of publication ( P = 0.80), number of authors ( P = 0.91, P = 0.17), and number of centers ( P = 0.25) are not significant predictors of quality reporting. Studies published in Asia and Australia had lower scores compared with those published in Europe ( P = 0.005) ( Table V ).


