Introduction
The aims of this study were to use 3-dimensional simulation and modeling programs to evaluate the effects of bimaxillary orthognathic surgical correction of Class III malocclusions on pharyngeal airway space volume, and to compare them with the changes in obstructive sleep apnea measurements from polysomnography.
Methods
Twenty-five male patients (mean age, 21.6 years) with mandibular prognathism were treated with bilateral sagittal split osteotomy and LeFort I advancement. Polysomnography and computed tomography were performed before surgery and 1.4 ± 0.2 years after surgery. All computed tomography data were transferred to a computer, and the pharyngeal airway space was segmented using SimPlant OMS (Materialise Medical, Leuven, Belgium) programs. The pretreatment and posttreatment pharyngeal airway space determinants in volumetric, linear distance, and cross-sectional measurements, and polysomnography changes were compared with the paired samples t test. Pearson correlation was used to analyze the association between the computed tomography and polysomnography measurements.
Results
The results indicated that setback procedures produce anteroposterior narrowing of the pharyngeal airway space at the oropharyngeal and hypopharyngeal levels and the middle and inferior pharyngeal volumes ( P <0.05). In contrast, advancement of the maxilla causes widening of the airway in the nasopharyngeal and retropalatal dimensions and increases the superior pharyngeal volume ( P <0.05). Distinctively, bimaxillary orthognathic surgery induces significant increases in the total airway volume and the transverse dimensions of all airway areas ( P <0.05). Significant correlations were found between the measurements on the computed tomography scans and crucial polysomnography parameters.
Conclusions
Bimaxillary orthognathic surgery for correction of Class III malocclusion caused an increase of the total airway volume and improvement of polysomnography parameters. A proposed treatment plan can be modified according to the risk of potential airway compromise or even to improve it with 3-dimensional imaging techniques and polysomnography.
Highlights
- •
Bimaxillary orthognathic surgery to correct Class III malocclusion increased total airway volume.
- •
Bimaxillary orthognathic surgery to correct Class III malocclusion improved polysomnography parameters.
- •
Treatment plans could be modified according to the airway compromise.
Orthognathic surgery has gained wide popularity in maxillofacial surgery over the last 30 to 40 years. Recently, mandibular setback surgery has decreased in frequency and is used in less than 10% of mandibular prognathism patients; 2-jaw surgery was preferred in about 40% of patients; maxillary advancement alone is performed in the remaining patients. One aspect of these surgeries, which has gained prominence over the last 2 decades, is the effect of the skeletal movements on the pharyngeal airway space (PAS). Many investigations support the idea that after surgical movement of the jaws, changes in the positions of the tongue and hyoid bone also occur, resulting in narrowing of the PAS. Research in this area shows an association between the PAS and obstructive sleep apnea (OSA). Thus, it can be concluded that any alteration of the facial skeleton that replicates these features can provoke some airway disorder.
Bimaxillary orthognathic surgery for Class III correction could be an alternative to mandibular setback surgery if there is less risk for restriction of the upper airways because a smaller mandibular setback would be needed, and hence more space would be available for the tongue. However, most studies have reported a significant reduction of the upper airway. These studies compared the radiographic changes that patients experienced postoperatively without investigating the possibility of the development of OSA on the basis of polysomnography (PSG). The specificity and accuracy of PSG has made it the standard diagnostic test for OSA.
Two-dimensional (2D) lateral cephalograms have traditionally served as the radiographic standard for airway assessment. Although cephalometric measurements are useful for analyzing airway size in the sagittal plane, they do not accurately depict the 3-dimensional (3D) airway anatomy. Finally, although the most physiologically relevant information is obtained from axial images, perpendicular to the direction of airflow, the axial plane cannot be visualized on lateral cephalograms. In contrast, an accurate 3D image of the airway can be obtained using computed tomographic (CT) data in the coronal, axial, and sagittal planes.
Although in many studies changes were demonstrated among patients with bimaxillary orthognathic surgery, the correlation between severity and prevalence of sleep apnea and airway parameters has not been examined. The purposes of this study were to investigate the morphologic changes in PAS after bimaxillary orthognathic surgery in patients with Angle Class III malocclusion using a 3D modeling program and PSG, and to investigate possible correlations among the studied PSG variables and the 3D airway morphology in these patients.
Material and methods
All patients’ written informed consent was obtained. Then, the patients underwent bimaxillary orthognathic surgery at the Dental Sciences Center, Gulhane Military Medical Academy, Turkey. In all patients, based on the cephalometric analysis, anteroposterior maxillary hypoplasia combined with anteroposterior mandibular excess had been diagnosed. The study group consisted of 25 male patients; average age at the time of surgery was 21.6 ± 2.7 years (range, 19-25 years), and mean body mass index values before (T0) and 1.4 ± 0.2 years after (T1) bimaxillary orthognathic surgery were 22.5 and 21.9 kg/m 2 , respectively. Patients with breathing problems; craniofacial anomalies; chronic upper airway diseases; previous tonsillectomy, adenoidectomy, genioplasty, or orthognathic surgery; and excessive obesity were excluded from the study.
The surgical technique was identical, and only patients with LeFort I advancement osteotomy without impaction combined with bilateral sagittal split osteotomy with the Obwegeser-Dal Pont method were included in the study. The ranges of maxillary advancement and mandibular setback were 3 to 9 mm (mean, 5.1 ± 2.9 mm) and 5 to 10 mm (mean, 6.9 ± 2.9 mm), respectively. Rigid fixation with titanium miniplates was used in all patients. All patients had maxillomandibular fixation for approximately 2 weeks postoperatively. Each patient had presurgical and postsurgical orthodontic treatment for averages of 7.6 and 5.7 months, respectively.
Every patient underwent a 1-night sleep study at the Sleep Research Center at Gulhane Military Medical Academy, Turkey, before and more than 1 year after surgery. The evaluations showed that 11 patients had no problem related to airway obstruction or snoring during sleep preoperatively (apnea-hypopnea index [AHI] <5), 9 patients were diagnosed as simple snorers (AHI <5), and 5 were diagnosed with mild OSA (5 ≤ AHI ≤15). Sleep parameters were recorded on a 32-channel polygraph (Somno Star Alpha Series-4; Sensor Media, Yorba Linda, Calif). The sleep respiratory information, including AHI, sleep efficiency, sleep stages (weakness, first stage, second stage, third stage, and fourth stage), rapid eye movements, and mean lowest arterial oxygen saturation, was used for data analysis.
This project was approved by the ethics committee of the Institute of Health Sciences of Gulhane Military Medical Academy, Turkey. All CT examinations were performed using a 64-detector CT scanner (Aquilion64; Toshiba Medical Systems, Otawara, Japan), with the patients in the supine position. Scan parameters were 120 kV, 150 mA, and a 400-ms rotation time with a slice thickness less than 0.5 mm and increments of 0.4 mm, using a detector collimation of 64 × 0.5 mm, including the patient’s entire head.
The CT scans were obtained 1 week before treatment and more than 1 year after the bimaxillary orthognathic surgery while the patients were supine with the head and neck in a neutral position; the Frankfort horizontal plane was perpendicular to the floor. For a standardized position of the oropharyngeal structures, the examinations were obtained at the end of expiration, without swallowing, in natural head posture, and in centric occlusion, because centric occlusion minimizes the variability of mandibular and soft-tissue measurements often associated with rest position. A cephalostat was not used during the CT data acquisition to allow for the natural position that was unique for each subject. The patients were instructed to hold their breath at end of expiration, when the scan was done. Axial sections were obtained starting from the top of the cranium to the fourth cervical vertebra. All sections were perpendicular to the airway lumen to allow accurate assessment of the linear and volumetric measurements of the PAS.
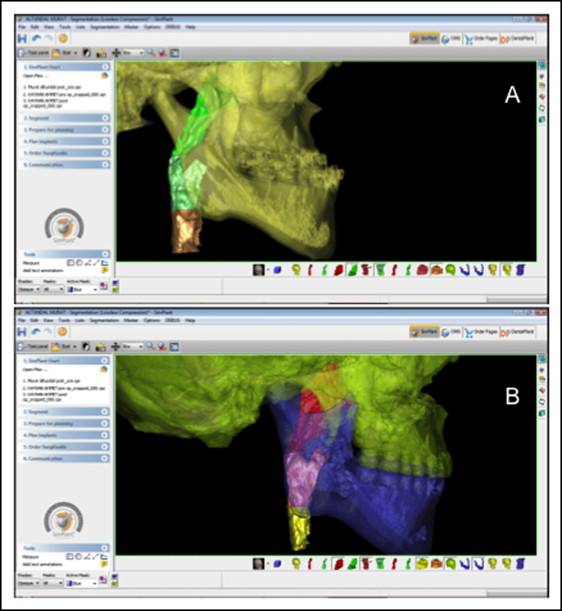
The data from the CT images were transferred to a network computer workstation on which the 2D reformatted images were generated and measured. The software used in this study to build the 3D virtual models and perform the 3D analysis of the PAS was SimPlant OMS (Materialise Medical, Leuven, Belgium). SimPlant imported 2D stacked CT images and displayed the data in several ways by dividing the screen into 4 views: original axial, coronal, sagittal, and 3D. The airway and craniofacial structures were visualized in 3 dimensions; the sagittal and transversal linear measurements, and the cross-sectional areas and volumes were measured and calculated.
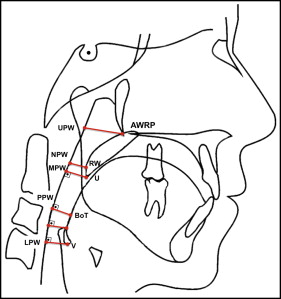
Landmarks, linear distances, cross-sectional areas, and volumetric measurements used in this study are shown in Tables I and II and Figure 1 . The same investigator (H.S.G.) evaluated all CT images and performed all measurements. The following parameters were measured. Linear distances on the sagittal and transversal planes: (1) the narrowest part of the nasopharynx, (2) retropalatal airway space, (3) retroglossal airway space, and (4) hypopharynx. Cross-sectional areas: (5) nasopharyngeal, (6) retropalatal, (7) oropharyngeal, and (8) hypopharyngeal. Three-dimensional volumes: (9) superior pharyngeal airway, (10) middle pharyngeal airway, (11) inferior pharyngeal airway, and (12) total airway volumes.
| Landmark | Definition | |
|---|---|---|
| AWRP | Retropalatal anterior pharyngeal wall | The point on the retropalatal anterior pharyngeal wall, just behind the posterior nasal spine (PNS) point |
| UPW | Upper pharyngeal wall | The intersection point of posterior pharyngeal wall and the line from basion (B) to PNS |
| NPW | Narrowest pharyngeal wall | The intersection of the posterior pharyngeal wall to the narrowest space of the retropalatal region |
| RV | Retrovelar | The intersection of the posterior surface of the soft palate to the narrowest space of the retropalatal region |
| U | Uvula | The tip of the soft palate, the most postero-inferior point of the uvula |
| MPW | Middle pharyngeal wall | The intersection of the perpendicular line from U with the posterior pharyngeal wall |
| BoT | Base of the tongue | The most posterior point on the radix linguae (base of the tongue) to the posterior pharyngeal wall |
| PPW | Posterior pharyngeal wall | The closest point on the retroglossal posterior pharnygeal wall to the base of the tongue measured perpendicularly to the direction of the airway |
| V | Vallecula | The intersection of epiglottis and the base of the tongue |
| LPW | Lower pharyngeal wall | The intersection of a perpendicular line from V with the posterior pharyngeal wall |
| Landmark | Definition |
|---|---|
| Distances | |
| AWRP-UPW | The narrowest part of the nasopharynx (the distance of the closest point of the retropalatal anterior pharyngeal wall to the posterior pharyngeal wall to the horizontal counterpoint on the posterior pharyngeal wall) |
| RV-NPW | The narrowest retropalatal airway space (the narrowest distance between the soft palate (SP) and the posterior pharyngeal wall, measured by a perpendicular line from the posterior pharyngeal wall, representing the minimal airway dimension at the retropalatal region) |
| BoT-PPW | The narrowest retroglossal airway space (the narrowest distance between BoT and the posterior pharyngeal wall, measured by a perpendicular line from the posterior pharyngeal wall) |
| V-LPW | The narrowest part of the hypopharynx (the distance from vallecula of epiglottis (Epg) to the horizontal counterpoint on the posterior pharyngeal wall) |
| Cross-sectional areas | |
| Nasopharyngeal cross-sectional area (NPa) | Along a horizontal plane at the narrowest distance between the retropalatal anterior pharyngeal wall to the posterior pharyngeal wall (AWRP-UPW) |
| Retropalatal cross-sectional area (RPa) | Along a horizontal plane at the narrowest distance between the SP and posterior pharyngeal wall (RV-NPW) |
| Oropharyngeal cross-sectional area (OPa) | Along a horizontal plane at the narrowest distance between the BoT and the posterior pharyngeal wall (BoT-PPW) |
| Hypopharyngeal cross-sectional area (HPa) | Along a horizontal plane at the tip of the epiglottis |
| Volumes | |
| Superior pharyngeal airway volume (SPAV) | Airway formed by the roof of the airway and RV-NPV plane |
| Middle pharyngeal airway volume (MPAV) | Airway formed by the RV-NPV and BoT-PPW planes |
| Inferior pharyngeal airway volume (IPAV) | Airway formed by the BoT-PPW and the plane passing through the upper border of larynx and perpendicular to sagittal plane (V-LPW) |
| Total airway volume (TAV) | Airway extending from roof of the airway to the upper border of larynx |
The levels for the linear and cross-sectional area measurements were settled on the midsagittal CT scan through the nasal septum. Cross-sectional areas were calculated automatically by the software at determined levels on the axial slices in square millimeters. The preoperative and postoperative upper airway volumes of each patient were studied in 3 levels of the upper airway by segmenting the region of interest in the CT scans. The borders of the PAS were formed as follows: (1) anterior, a vertical plane through the distal margin of the vomer, the soft palate, the base of the tongue, and the anterior wall of the pharynx; (2) posterior, the posterior wall of the pharynx; (3) lateral, the lateral walls of the pharynx; (4) upper, the roof of the nasopharynx; and (5) lower, a plane passing through the upper border of the larynx perpendicular to the sagittal plane ( Fig 2 ).
Statistical analysis
The descriptive statistics of the preoperative and postoperative measurements were analyzed using SPSS software (version 12.0.1 for Windows; SPSS, Chicago, Ill). The before and after treatment PAS measurements and the PSG variables were compared with paired samples t tests. Additionally, the Pearson correlation analysis was conducted between airway parameters and PSG data to determine the association between airway dimensions and objective indicators of sleep apnea severity. P <0.05 was considered statistically significant.
All parameters were measured by 1 author (S.M.G.). Because of the investigation of the reliability of the measurements, 15 patients were selected randomly, and their CT images were measured again 10 days later. The Wilcoxon signed rank test was applied to the first and second measurements of these images; this was not statistically significant ( P >0.05).
Results
The mean maxillary advancement achieved at T1 compared with T0 was 5 ± 2.2 mm at A-point. For mandibular movement, a mean setback of 6.5 ± 2.7 mm was found at T1 at B-point.
The paired samples t test results comparing the preoperative and postoperative measurements are shown in Tables III through VIII . The linear, cross-sectional area, and volumetric measurements at T0 and T1 are presented in Figures 3 through 6 .
| T0 | T1 | T0-T1 | ||||||||||||
|---|---|---|---|---|---|---|---|---|---|---|---|---|---|---|
| Mean | SD | 95% CI | Mean | SD | 95% CI | MD | SD | 95% CI | Test statistics | P | ||||
| Lower bound | Upper bound | Lower bound | Upper bound | Lower bound | Upper bound | |||||||||
| AWRP-UPWsag | 16.05 | 4.23 | 14.24 | 18.32 | 18.11 | 5.29 | 16.47 | 21.24 | −2.06 | 1.28 | −3.33 | −0.8 | t = −3507 | 0.003 † |
| RV-NPWsag | 9.55 | 2.45 | 8.97 | 11.23 | 10.81 | 3.56 | 9.23 | 13.77 | −1.26 | 1.01 | −2.38 | −0.14 | t = −2433 | 0.029 ∗ |
| BoT-PPWsag | 11.81 | 3.03 | 9.24 | 13.45 | 10.34 | 3.78 | 9.99 | 14.02 | 1.46 | 1.29 | 0.19 | 2.73 | t = 2475 | 0.027 ∗ |
| V-LPWsag | 11.65 | 4.11 | 10.04 | 13.87 | 9.92 | 2.97 | 7.86 | 13.54 | 1.73 | 1.15 | 0.54 | 2.92 | t = 3117 | 0.008 † |
| T0 | T1 | T0-T1 | ||||||||||||
|---|---|---|---|---|---|---|---|---|---|---|---|---|---|---|
| Mean | SD | 95% CI | Mean | SD | 95% CI | MD | SD | 95% CI | Test statistics | P | ||||
| Lower bound | Upper bound | Lower bound | Upper bound | Lower bound | Upper bound | |||||||||
| AWRP-UPWtrans | 23.05 | 6.57 | 19.13 | 28.65 | 25.04 | 8.32 | 18.33 | 21.25 | −1.47 | 1.18 | −2.56 | −0.23 | t = −4874 | 0.043 ∗ |
| RV-NPWtrans | 20.89 | 5.22 | 21.24 | 25.03 | 22.86 | 5.97 | 19.45 | 18.75 | −1.97 | 1.11 | −3.03 | −1.38 | t = −3674 | 0.039 ∗ |
| BoT-PPWtrans | 26.78 | 4.65 | 24.34 | 30.43 | 27.88 | 7.12 | 20.22 | 23.74 | −1.1 | 1.2 | −2.83 | −0.45 | t = −2745 | 0.044 ∗ |
| V-LPWtrans | 29.66 | 7.32 | 23.12 | 32.34 | 31.35 | 9.21 | 23.86 | 28.42 | −1.69 | 1.15 | −2.32 | −0.99 | t = −2813 | 0.042 ∗ |
| T0 | T1 | T0-T1 | ||||||||||||
|---|---|---|---|---|---|---|---|---|---|---|---|---|---|---|
| Mean | SD | 95% CI | Mean | SD | 95% CI | MD | SD | 95% CI | Test statistics | P | ||||
| Lower bound | Upper bound | Lower bound | Upper bound | Lower bound | Upper bound | |||||||||
| NPa | 230.91 | 95.34 | 145.89 | 326.78 | 403.46 | 116.84 | 502.48 | 389.45 | −170.58 | 50.28 | −217.8 | −119.23 | t = −5534 | 0.011 ∗ |
| RPa | 139.25 | 62.47 | 89.54 | 203.69 | 311.3 | 102.49 | 414.23 | 297.46 | −171.70 | 54.00 | −220.40 | −121.80 | t = −5685 | 0.012 ∗ |
| OPa | 278.53 | 83.78 | 196.32 | 323.24 | 224.52 | 65.81 | 173.12 | 301.49 | 55.34 | 17.8 | 37.15 | 84.33 | t = 2621 | 0.04 ∗ |
| HPa | 295.41 | 77.15 | 222.45 | 325.98 | 230.14 | 69.18 | 199.53 | 299.53 | 65.88 | 18.19 | 48.17 | 84.66 | t = 3713 | 0.03 ∗ |
| T0 | T1 | T0-T1 | ||||||||||||
|---|---|---|---|---|---|---|---|---|---|---|---|---|---|---|
| Mean | SD | 95% CI | Mean | SD | 95% CI | MD | SD | 95% CI | Test statistics | P | ||||
| Lower bound | Upper bound | Lower bound | Upper bound | Lower bound | Upper bound | |||||||||
| SPAV | 10232 | 1225 | 8916 | 1297 | 14976 | 1987 | 12999 | 17021 | −4744 | 567 | −5234 | −4012 | t = −5016 | <0.001 ‡ |
| MPAV | 7625 | 865 | 6823 | 9102 | 6176 | 786 | 5239 | 7023 | 1449 | 287 | 1116 | 1932 | t = 1523 | 0.032 ∗ |
| IPAV | 5762 | 767 | 5011 | 6589 | 4179 | 489 | 3816 | 4967 | 1583 | 338 | 1184 | 2012 | t = 1597 | 0.043 ∗ |
| TAV | 23619 | 2712 | 20156 | 29345 | 25331 | 2925 | 22314 | 30377 | −1712 | 566 | −2158 | −1032 | t = −1681 | 0.002 † |
| T0 | T1 | T0-T1 | ||||||||||||
|---|---|---|---|---|---|---|---|---|---|---|---|---|---|---|
| Mean | SD | 95% CI | Mean | SD | 95% CI | MD | SD | 95% CI | Test statistics | P | ||||
| Lower bound | Upper bound | Lower bound | Upper bound | Lower bound | Upper bound | |||||||||
| AHI | 5.15 | 3.01 | 2.45 | 11.33 | 2.91 | 1.09 | 0.23 | 4.11 | 2.24 | 1.91 | 0.34 | 3.15 | t = 2.816 | 0.04 ∗ |
| Sleep efficiency (%) | 85.4 | 2.13 | 83.29 | 87.75 | 91.77 | 3.12 | 88.56 | 94.12 | −6.39 | 2.3 | −8.75 | −4.15 | t = −5.437 | <0.001 ‡ |
| Sleep stage weakness (%) | 11.13 | 2.92 | 9.86 | 13.05 | 7.15 | 2.34 | 5.33 | 9.01 | 3.89 | 1.98 | 2.34 | 4.91 | t = 3.577 | 0.003 † |
| Sleep stage 1 (%) | 8.14 | 2.23 | 6.94 | 10.44 | 3.45 | 1.16 | 2.31 | 5.02 | 4.65 | 2.01 | 2.32 | 6.23 | t = 6.711 | <0.001 ‡ |
| Sleep stage 2 (%) | 70.96 | 4.23 | 67.55 | 74.13 | 60.11 | 3.99 | 57.23 | 63.07 | 10.83 | 3.76 | 7.11 | 13.65 | t = 8.516 | <0.001 ‡ |
| Sleep stage 3 (%) | 4.01 | 2.2 | 3.11 | 6.43 | 7.35 | 2.34 | 5.12 | 9.87 | −3.34 | 1.65 | −4.88 | −2.15 | t = −6.905 | <0.001 ‡ |
| Sleep stage 4 (%) | 11.53 | 2.45 | 10.81 | 14.15 | 15.12 | 2.88 | 13.21 | 17.94 | −3.57 | 1.89 | −5.06 | −2.23 | t = −11.237 | <0.001 ‡ |
| REM (%) | 7.77 | 2.87 | 5.86 | 9.32 | 15.02 | 3.21 | 12.96 | 17.97 | −7.25 | 2.67 | −9.79 | −5.54 | t = −5.835 | <0.001 ‡ |
| Mean oxygen saturation (%) | 91.28 | 2.34 | 85.2 | 96.85 | 96.76 | 3.45 | 91.27 | 99.45 | −5.44 | 2.69 | −9.98 | −3.23 | t = −5.362 | 0.001 † |
| Definition | Pearson correlation | AHI | Sleep efficiency | Sleep stage weakness | Sleep stage 1 | Sleep stage 2 | Sleep stage 3 | Sleep stage 4 | REM | Mean oxygen saturation |
|---|---|---|---|---|---|---|---|---|---|---|
| AWRP-UPWsag | r | −0.493 | 0.403 | −0.01 | −0.1 | −0.351 | 0.113 | 0.238 | 0.032 | 0.389 |
| P value | 0.002 † | 0.017 ∗ | nc | nc | nc | nc | nc | nc | 0.029 ∗ | |
| RV-NPWsag | r | −0.436 | 0.381 | −0.073 | −0.65 | −0.343 | 0.143 | 0.244 | 0.015 | 0.432 |
| P value | 0.009 † | 0.02 ∗ | nc | nc | nc | nc | nc | nc | 0.012 ∗ | |
| BoT-PPWsag | r | −0.445 | 0.344 | −0.345 | −0.055 | −0.224 | 0.176 | 0.211 | 0.076 | 0.478 |
| P value | 0.007 † | 0.043 ∗ | nc | nc | nc | nc | nc | nc | 0.001 ∗ | |
| V-LPWsag | r | −0.424 | 0.399 | −0.084 | −0.121 | −0.188 | 0.142 | 0.232 | 0.023 | 0.455 |
| P value | 0.012 ∗ | 0.02 ∗ | nc | nc | nc | nc | nc | nc | 0.009 † | |
| AWRP-UPWtrans | r | −0.05 | 0.124 | −0.07 | −0.052 | −0.172 | 0.165 | 0.177 | 0.124 | 0.231 |
| P value | nc | nc | nc | nc | nc | nc | nc | nc | nc | |
| RV-NPWtrans | r | −0.073 | 0.109 | −0.033 | 0.092 | −0.272 | 0.231 | 0.189 | 0.235 | 0.239 |
| P value | nc | nc | nc | nc | nc | nc | nc | nc | nc | |
| BoT-PPWtrans | r | −0.313 | 0.182 | −0.275 | 0.321 | −0.27 | 0.212 | 0.231 | 0.266 | 0.288 |
| P value | nc | nc | nc | nc | nc | nc | nc | nc | nc | |
| V-LPWtrans | r | −0.324 | 0.101 | −0.126 | 0.308 | −0.202 | 0.242 | 0.201 | 0.203 | 0.201 |
| P value | nc | nc | nc | nc | nc | nc | nc | nc | nc | |
| NPa | r | −0.424 | 0.414 | −0.09 | −0.352 | −0.312 | 0.115 | 0.042 | 0.302 | 0.529 |
| P value | 0.003 † | 0.01 ∗ | nc | nc | nc | nc | nc | nc | 0.001 † | |
| RPa | r | −0.466 | 0.436 | −0.133 | −0.338 | −0.391 | 0.118 | 0.063 | 0.295 | 0.416 |
| P value | 0.004 † | 0.009 † | nc | nc | nc | nc | nc | nc | 0.017 ∗ | |
| OPa | r | −0.554 | 0.385 | −0.109 | −0.005 | −0.401 | 0.091 | 0.021 | 0.315 | 0.517 |
| P value | 0.032 ∗ | 0.021 ∗ | nc | nc | nc | nc | nc | nc | 0.001 † | |
| HPa | r | −0.428 | 0.387 | −0.006 | −0.288 | −0.382 | 0.101 | 0.162 | 0.322 | 0.438 |
| P value | 0.033 ∗ | 0.027 ∗ | nc | nc | nc | nc | nc | nc | 0.009 † | |
| SPAV | r | −0.579 | 0.668 | −0.143 | −0.142 | −0.234 | 0.297 | 0.187 | 0.373 | 0.654 |
| P value | <0.001 ‡ | <0.001 ‡ | nc | nc | nc | nc | nc | 0.029 ∗ | <0.001 ‡ | |
| MPAV | r | −0.548 | 0.333 | −0.163 | −0.151 | −0.267 | 0.276 | 0.143 | 0.366 | 0.554 |
| P value | <0.001 ‡ | 0.048 ∗ | nc | nc | nc | nc | nc | 0.032 ∗ | 0.001 † | |
| IPAV | r | −0.566 | 0.402 | 0.145 | −0.063 | −0.299 | 0.168 | 0.291 | 0.331 | 0.637 |
| P value | <0.001 ‡ | 0.015 ∗ | nc | nc | nc | nc | nc | 0.049 ∗ | <0.001 ‡ | |
| TAV | r | −0.543 | 0.523 | 0.047 | −0.069 | −0.301 | 0.199 | 0.248 | 0.342 | 0.568 |
| P value | 0.004 † | 0.001 † | nc | nc | nc | nc | nc | 0.04 ∗ | <0.001 ‡ |
Stay updated, free dental videos. Join our Telegram channel
VIDEdental - Online dental courses


