Introduction
The purposes of this study were to (1) evaluate facial asymmetry 3 dimensionally using cone-beam computed tomography (CBCT) and (2) compare the right and left facial hard and soft tissues volumetrically and their interferences on each other.
Methods
The CBCT data of 49 asymmetric (soft tissue menton deviation, ≥4 mm; distance from the facial midline) (mean age, 19.9 ± 5.6 years) and 39 symmetric patients (soft tissue menton deviation, <4 mm) (mean age, 17.8 ± 5.5 years) were exported to the MIMICS software program (version 13.0; Materialise, Leuven, Belgium). Linear, surface distance, angular, volumetric, and surface area measurements were performed 3 dimensionally to assess and compare intragroup and intergroup differences.
Results
In the asymmetry group, linear measurements such as ramus height, mandibular effective and corpus length, and absolute mandibular volumetric measurements were significantly decreased ( P <0.001), whereas facial mandibular, and soft and hard tissue volumetric measurements made on 3-dimensional images, and linear measurements on 2-dimensional images were increased ( P <0.001) on the deviation side.
Conclusions
Facial hard and soft tissue asymmetries can be precisely quantified using CBCT. However, especially in the gonial region where the surface topography shows alterations caused by asymmetry, many anatomic landmarks should be chosen for the assessment of asymmetry. At the gonial level, the compensation of the soft tissues for the hard tissues was found on 2-dimensional images; nevertheless, 3-dimensional right and left volumetric soft tissue evaluations provide evidence for asymmetry.
Highlights
- •
We used cone-beam computed tomography to examine facial asymmetry.
- •
Linear, surface distance and area, and angular and volumetric measurements were made.
- •
Asymmetry was frequently identified in the lower third of the face.
- •
Morphologic regions should be evaluated in 3 dimensions with many landmarks.
- •
Skeletal asymmetries seemed to be compensated for by soft tissues at different levels.
In positive interpersonal communications, the first important domain is the appearance or beauty of the face. Symmetric faces are perceived as more attractive and healthy, serving as a rapid indicator of higher genetic quality. Consequently, people critically evaluate their own faces and wish to correct facial discrepancies that they consider unacceptable. Facial asymmetry has been determined to be the reason for patients to seek orthodontic evaluation in 25% of cases.
The human face is not always symmetric over the facial midline. Asymmetries and deviations within limits (fundamental asymmetries) are recognized as normal. However, severe or pathologic asymmetry of the craniofacial complex affecting teeth, soft tissues, and skeletal units is not acceptable and needs combined orthodontic and surgical treatment.
Facial asymmetry is more frequently identified in the lower third of the face. Severt and Proffit demonstrated that facial asymmetry affects the upper face in only 5%, the midface in 36%, and the lower face in 74% of the examined subjects. The fact that the mandible is a mobile bone that grows over a longer period than the maxilla has been reported as the reason for the increased frequency of lower facial asymmetry. Mandibular asymmetry may occur due to right and left condylar or ramal vertical dimensional discrepancies, differences between the corpus lengths of the 2 sides or a rotational and deviated position of the mandible. Although asymmetry is more significant in the mandible, there can also be different levels of asymmetry in the maxilla.
Facial appearance is basically composed of both the hard and soft tissues (muscles, skin, and fat) that make up this skeletal unit. Consequently, not only the skeleton but also the soft tissues of the craniofacial region must be evaluated for adequate diagnosis of asymmetry. McCance et al showed that facial skeletal asymmetries are apparent at clinical observations, whereas Burstone and Shah and Joshi demonstrated that the overlying soft tissue components can compensate for underlying skeletal asymmetry. Additionally, Masuoka et al reported that patients who are clinically classified as symmetric or mildly asymmetric might have severe skeletal asymmetries when assessed on posteroanterior radiographs.
Determination of the tissues and regions with craniofacial asymmetry undoubtedly leads to better treatment plans. For many years 2-dimensional (2D) diagnostic tools have been used to diagnose asymmetry, but magnification, distortion, and superimposition problems could not be overcome. Moreover, 2D radiographs provide only limited information about soft tissues.
Three-dimensional (3D) evaluation is needed to understand the complex nature of craniofacial asymmetry and to differentiate the fundamental phenomena from pathologic cases. Cone-beam computed tomography (CBCT) allows evaluation of asymmetry via volumetric, surface area, and distance measurements, which can show asymmetry and morphology more realistically.
Interest in facial asymmetry in orthodontics has increased in recent years. In many studies, asymmetry was identified using 2D diagnostic tools that caused underestimation of the 3D nature of the pathology. Three-dimensional evaluation studies highlight the hard tissues but do not show the soft tissue components of the facial asymmetry. Studies investigating the relationship between soft and hard tissues have been based on a few measurements of limited regions of the face. Therefore, the purposes of this study were (1) to evaluate facial asymmetry 3 dimensionally with linear, surface distance, angular, volumetric, and surface area measurements with CBCT and (2) to compare the right and left facial hard and soft tissue volumetric measurements to assess whether there were compensations.
Material and methods
The chin was found to be strongly related to facial asymmetry; therefore, asymmetry was defined by the extent of soft-tissue menton (Me′) deviation from the midsagittal reference line, crossing from glabella and perpendicular to the pupillary line, by clinical evaluation in this study. Patients with less than 4 mm of Me′ deviation from the midsagittal reference line were categorized as symmetric and comprised the control group, whereas patients with 4 mm or more of Me′ deviation comprised the asymmetry group, similar to the study of Haraguchi et al. Additionally, the asymmetry group was subdivided into 2 groups: (1) the ramus-originated asymmetry group in which bilateral ramus height measurement differences were greater than bilateral corpus length measurement differences and (2) the corpus-originated asymmetry group in which bilateral corpus length measurement differences were greater than bilateral ramus height measurement differences.
Forty-nine patients with asymmetry were enrolled in this study, and CBCT scans were taken for diagnostic purposes at the onset of orthodontic treatment. Data from 39 control patients were taken from the archive of the Department of Orthodontics at Yeditepe University in Istanbul, Turkey; they had undergone a 3D CBCT scan for other purposes, such as identification of impacted tooth locations or mini-implant placement. Patient characteristics (sex, age, malocclusion classification, and Me′ deviation) of both groups are given in Table I . Patients with syndromes or significant pathologies affecting craniofacial appearance, such as trauma or infection, or degenerative disease of the temporomandibular joint, or who had undergone functional orthopedic treatment were excluded from the study. The mean ages of the symmetry and asymmetry groups were 17.8 ± 5.5 and 19.9 ± 5.6 years, respectively. All subjects (minimum age, 12 years; maximum age, 30 years), evaluated by hand and wrist radiographs, were at the end of the pubertal growth spurt or adults. This study was approved by the ethical committee of Yeditepe University.
| Sex | Age (y) | Malocclusion class | Me′deviation (mm) | |||||
|---|---|---|---|---|---|---|---|---|
| Male (n) | Female (n) | Total (n) | Mean ± SD | I | II | III | Mean ± SD | |
| Control group | 18 | 21 | 39 | 17.8 ± 5.5 | 22 | 10 | 7 | 2.17 ± 1.11 |
| Asymmetry group | 27 | 22 | 49 | 19.9 ± 5.6 | 18 | 18 | 3 | 5.41 ± 1.37 |
All 3D scans were obtained using a CBCT scanner (Iluma; IMTEC Imaging, Diegem, Belgium) at 120 kV, 1.0 mA, voxel size of 0.4 mm, and field of view of 21.1 × 14.2 cm. The patients were scanned for 40 seconds while sitting upright with the head in a natural position in centric occlusion. After the scanning, the slices were reconstructed after the reorientation of head position. By paralleling the right and left orbitales to the floor on the coronal section and by perpendicularly setting the sella and nasion line to the screen on the axial section, tilting and right-left orientation of the head were prevented.
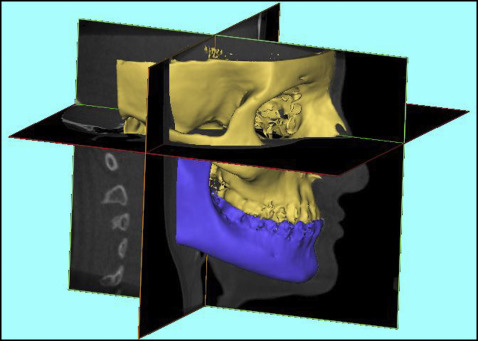
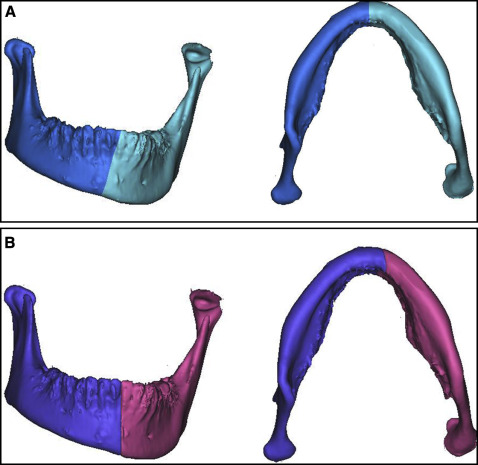
The data were stored in the DICOM (digital images and communication in medicine) format and exported to the MIMICS software program (version 13.0; Materialise, Leuven, Belgium) for analysis. The plane crossing the bilateral orbitale and right porion points was defined as the horizontal plane. The midsagittal reference plane, crossing the anatomic landmarks sella and nasion perpendicular to the horizontal plane, was defined as the facial midline (FML), similar to the definition used in the study of Ryckman et al ( Fig 1 ). With the automatic function of gray-scale thresholding of the software program, soft tissues (–700-225 HU) were removed from the hard tissues (226-3071 HU), and data from each were stored in separate files. Hyoid bone, vertebrae, and structures posterior to the meatus acusticus externus were cropped from the field of view. After thresholding, 2 files were created: soft tissues and hard tissues. The mandible was erased using the negative construction function from the hard tissue file, and the new file was saved as a maxillary complex file. Using the Boolean operation function, the maxillary complex file was extracted from the original hard tissue file, and a new file including the mandible was constructed. The duplicated hard and soft tissue files were then separated into right and left segments through the FML. Additionally, the mandible was also divided into 2 volumetric segments via the absolute mandibular reference line passing through the anatomic hard tissue menton and mental spine points perpendicular to the horizontal plane, which were defined as the absolute mandibular segments ( Fig 2 ). The side toward which the Me′ was shifted was categorized as the deviation side (A), and the opposite side as the nondeviation side (B).
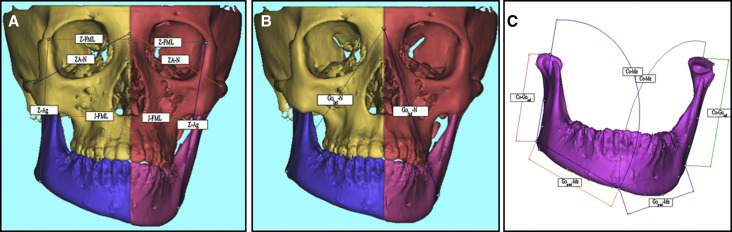
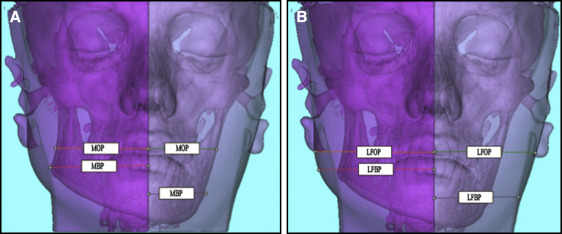
Anatomic landmarks were located on the 3D images bilaterally, and their locations were verified in all 3 planes ( Table II ). Linear, surface distance, and angular measurements were made on hard and soft tissues ( Table III ; Fig 3 ). Linear and surface distance measurements were defined as the shortest linear distance and the shortest distance in regard to the topography of the anatomic surface between 2 points, respectively. These are 3D measurements; thus, they measured the distance of 3D anatomic points on 3D images. Skeletal and corresponding 2D soft tissue linear measurements were also made as described by Hong et al using the translucency function of the software program, which shows both the soft and hard tissue components at the same frontal image ( Table III ; Fig 4 ). The distance between the midpoint of the maxillary central incisors and the most lateral border of the mandible was defined as the mandibular occlusal plane (MOP), whereas the extension of the same measurement to the most lateral soft tissue border at the same level was called the lateral facial occlusal plane (LFOP). The measurements of Golat-FML and the extension to the soft tissue border were recorded as the mandibular basal plane (MBP) and the lateral facial basal plane (LFBP), respectively. MOP, LFOP, MBP, and LFBP are the only 2D linear measurements projected on the frontal view and were preferred because of the poor reliability of 3D soft tissue points. See Tables II and III for definitions of the abbreviations.
| Landmark | Definition |
|---|---|
| Sella (S) | Center of the hypophyseal fossa |
| Nasion (N) | Midpoint of the frontonasal suture |
| Zygomaticofrontal (Z) | Most medial and anterior point of the zygomaticofrontal suture at the level of the lateral orbital rim |
| Zygomatic arch (ZA) | Most anterior, lateral, and midpoint of the zygomaticomaxillary suture on the zygomatic arch |
| Condylar (Co) | Most superior midpoint of the condylar head |
| Gonion lateralis (Golat) | Most lateral point between the mandibular corpus and the ramus junction |
| Gonion inferius (Goinf) | Most inferior point between the mandibular corpus and the ramus junction |
| Gonion posterius (Gopost) | Most posterior point between the mandibular corpus and the ramus junction |
| Menton (Me) | Most inferior midpoint in the symphysis |
| Soft tissue menton (Me′) | Most inferior midpoint of the chin |
| Antegonion (Ag) | Deepest point of the concavity between the mandibular corpus and the ramus junction |
| Jugulare (J) | Most inferior midpoint of the concavity at the zygomaticomaxillary process |
| Premolar (P) | Most superior point of the buccal cusp of the maxillary first premolar |
| Linear (3D) |
| Z-Ag distance |
| Z-FML distance |
| ZA-N distance |
| ZA-Goinf distance |
| J-FML distance |
| J-N distance |
| Go-FML distance |
| Co-Golat distance |
| Co-Goinf distance (ramus height) |
| Golat-Me distance |
| Gopost-Me distance (corpus length) |
| Co-Me distance |
| Golat-N distance |
| P-N distance |
| Me-FML distance (linear hard tissue menton deviation) |
| Me′-FML distance (linear soft tissue menton deviation) |
| Linear (2D) |
| MOP distance (mandibular occlusal plane) |
| LFOP distance (lateral facial occlusal plane) |
| MBP distance (mandibular basal plane) |
| LFBP distance (lateral facial basal plane) |
| Co-Golat distance |
| Surface distance (3D) |
| Golat-Me distance |
| CoGolat-MeGolat (gonial angle) |
| Angular (3D) |
| NMe-FML (angular hard tissue menton deviation) |
| NMe′-FML (angular soft tissue menton deviation) |
| ANB |
| Maxillary complex volume |
| Volumetric (3D) |
| Mandibular volume |
| Absolute mandibular volume |
| Hard tissue volume |
| Soft tissue volume |
| Maxillary complex surface area |
| Surface area (3D) |
| Mandibular surface area |
| Absolute mandibular surface area |
| Hard tissue surface area |
| Soft tissue surface area |
Volumetric and surface area measurements were performed on the right and left segments of the maxillary complex, the facial mandible, the absolute mandible, and the total facial hard and soft tissues. All measurements were redone in 20 CBCT data sets and reassessed after 30 days by the same investigator (R.B.N.).
Statistical analysis
All statistical analyses were performed using the SPSS software package for Windows (version 15.0; SPSS, Chicago, Ill). In addition to standard descriptive statistical calculations (means and standard deviations), the Wilcoxon test was used to compare the measurements between the nondeviated and deviated sides in each group. Measurement differences between the nondeviated and deviated sides were compared using the Mann-Whitney U test between the 2 groups. The Spearman correlation test was performed to determine correlations between hard and soft tissue measurements. To evaluate intraobserver reliability and method errors, the Wilcoxon test and the Dahlberg formula were used. The statistical significance level was set at P <0.05.
Results
The Wilcoxon test showed no significant differences between the first and second assessments of all measurements ( P >0.05). The random errors for the linear and volumetric measurements were between 0.01 and 0.9 mm and 0.21 and 0.64 cm 3 , respectively.
The mean linear and angular measurements for hard and soft tissue menton deviations from the midline were significantly longer and higher in the asymmetry group than in the control group ( Table IV ).
| Measurement | Asymmetry group (n = 49) | Control group (n = 39) | P value | ||
|---|---|---|---|---|---|
| Mean | SD | Mean | SD | ||
| Me-FML (mm) | 4.83 | 1.32 | 1.86 | 1.03 | 0.000* |
| NMe-FML (°) | 2.57 | 0.81 | 0.97 | 0.51 | 0.000* |
| Me′-FML (mm) | 5.41 | 1.37 | 2.17 | 1.11 | 0.000* |
| NMe′-FML (°) | 2.79 | 0.86 | 1.11 | 0.60 | 0.000* |
We compared the measurements between the deviated and nondeviated sides in the asymmetry and control groups. Significant differences in the measurements of ZA-Goinf, J-FML, J-N, Golat-FML, Co-Goinf, Golat-Me, Gopost-Me, Co-Me, P-N, MOP, and MBP were found between the deviated (A) and nondeviated (B) sides in the asymmetry group ( Table V ; Fig 3 , A and C ). In the control group, ZA-Goinf, J-N, Co-Goinf, Golat-Me, Gopost-Me, Co-Me, Golat-N, and P-N showed statistically significant differences between the 2 sides ( Table V ).
| Measurement | Comparison between sides | ||||||||||||||
|---|---|---|---|---|---|---|---|---|---|---|---|---|---|---|---|
| Asymmetry group (n = 49) | Control group (n = 39) | Comparison between groups | |||||||||||||
| Deviated side (A) | Nondeviated side (B) | P | Deviated side (A) | Nondeviated side (B) | P | Asymmetry group (n = 49) | Control group (n = 39) | P | |||||||
| Mean | SD | Mean | SD | Mean | SD | Mean | SD | Mean | SD | Mean | SD | ||||
| Z-Ag | 95.73 | 6.99 | 96.75 | 6.64 | 0.073 | 93.22 | 5.91 | 93.58 | 6.12 | 0.267 | −1.02 | 4.91 | −0.36 | 2.29 | 0.502 |
| Z-FML | 78.10 | 5.35 | 77.73 | 5.48 | 0.138 | 76.68 | 5.80 | 76.71 | 5.71 | 0.717 | 0.49 | 2.65 | 1.38 | 10.01 | 0.740 |
| ZA-N | 52.51 | 3.37 | 52.02 | 3.64 | 0.140 | 51.97 | 3.52 | 50.59 | 9.03 | 0.722 | 0.38 | 1.75 | −0.03 | 1.51 | 0.264 |
| ZA-Goinf | 65.43 | 5.91 | 67.84 | 5.51 | 0.000‡ | 63.55 | 5.60 | 64.24 | 5.80 | 0.000‡ | −2.41 | 4.40 | −0.68 | 0.81 | 0.000‡ |
| J-FML | 43.11 | 3.09 | 40.82 | 2.87 | 0.000‡ | 41.62 | 3.41 | 41.36 | 3.03 | 0.346 | 2.29 | 2.86 | 0.25 | 1.98 | 0.000‡ |
| J-N | 70.65 | 13.41 | 71.58 | 13.15 | 0.000‡ | 66.91 | 8.11 | 67.35 | 8.07 | 0.003† | −0.93 | 1.30 | −0.44 | 0.85 | 0.095 |
| Golat-FML | 84.22 | 4.86 | 81.15 | 5.47 | 0.000‡ | 79.74 | 5.79 | 78.95 | 5.40 | 0.120 | 3.07 | 3.43 | 0.79 | 2.71 | 0.000‡ |
| Co-Golat | 59.82 | 4.97 | 59.69 | 5.77 | 0.877 | 57.05 | 5.49 | 56.79 | 5.84 | 0.516 | 0.14 | 4.49 | 0.26 | 2.59 | 0.568 |
| Co-Goinf | 63.80 | 6.49 | 66.82 | 6.17 | 0.000‡ | 63.44 | 6.22 | 64.54 | 5.99 | 0.001† | −3.01 | 3.78 | −1.09 | 1.76 | 0.002† |
| Golat-Me | 81.40 | 5.19 | 82.76 | 5.01 | 0.000‡ | 78.51 | 5.70 | 79.89 | 6.75 | 0.023* | −2.38 | 1.70 | −1.38 | 3.58 | 0.059 |
| Gopost-Me | 86.74 | 5.91 | 89.69 | 5.87 | 0.000‡ | 85.35 | 6.61 | 86.53 | 6.66 | 0.000‡ | −2.95 | 1.37 | −1.18 | 0.98 | 0.000‡ |
| Co-Me | 119.69 | 7.33 | 122.63 | 8.03 | 0.000‡ | 115.20 | 8.94 | 116.41 | 8.57 | 0.000‡ | −2.94 | 2.74 | −1.21 | 1.56 | 0.002† |
| P-N | 83.99 | 7.14 | 85.00 | 7.39 | 0.000‡ | 82.76 | 12.01 | 83.19 | 11.85 | 0.019* | −1.01 | 1.00 | −0.43 | 1.04 | 0.025* |
| MOP | 56.95 | 5.19 | 54.13 | 5.72 | 0.001† | 53.76 | 4.98 | 53.60 | 5.14 | 0.978 | 2.82 | 6.30 | 0.16 | 5.23 | 0.011* |
| LFOP | 95.47 | 8.15 | 92.82 | 9.86 | 0.095 | 92.21 | 7.52 | 93.26 | 8.02 | 0.315 | 2.65 | 8.66 | −1.05 | 5.75 | 0.059 |
| MBP | 57.54 | 5.95 | 54.72 | 6.14 | 0.007† | 54.25 | 5.36 | 53.40 | 6.76 | 0.410 | 2.82 | 6.85 | 0.86 | 5.62 | 0.171 |
| LFBP | 86.98 | 7.53 | 86.14 | 9.32 | 0.933 | 82.12 | 6.37 | 82.96 | 8.61 | 0.406 | 0.84 | 7.99 | −0.84 | 6.79 | 0.629 |
| Surface distance (Co-Golat) | 70.80 | 6.19 | 71.20 | 6.92 | 0.274 | 67.23 | 6.24 | 67.23 | 6.90 | 0.558 | −0.40 | 4.86 | 0.00 | 3.37 | 0.303 |
| Surface distance (Golat-Me) | 93.78 | 6.63 | 95.65 | 6.61 | 0.000‡ | 89.99 | 7.44 | 91.26 | 7.17 | 0.078 | −2.57 | 3.30 | −1.28 | 3.88 | 0.297 |
| CoGolat-MeGolat (gonial angle) | 119.32 | 5.96 | 119.11 | 7.02 | 0.435 | 116.57 | 5.05 | 116.09 | 4.68 | 0.331 | −0.04 | 4.09 | 0.48 | 2.94 | 0.346 |
Stay updated, free dental videos. Join our Telegram channel
VIDEdental - Online dental courses


