Introduction
The aims of this study were to evaluate the distances between the mandibular permanent teeth and the alveolar process in Brazilians with normal occlusion and to compare them with normal American values.
Methods
We used 59 mandibular casts from untreated subjects who had permanent dentition and the 6 keys to normal occlusion. A computer program was used to calculate the distances between the dental reference points and the alveolar process for each tooth. The mean values were then compared to the normal values by applying the Student t test at a significance level of 0.05.
Results
The results showed a progressive increase of these distances from the anterior region (incisors) to the posterior region (molars), from 0.00 to 2.49 mm. All measurements had statistically significant differences from the American sample, except for the values for canines and first premolars.
Conclusions
Brazilians with normal occlusion have more lingual crown positions for the incisors, second premolars, and molars compared with Americans with normal occlusion. Although these findings were statistically significant, they are unlikely to be clinically significant.
Dental arch width and shape are important considerations for patients undergoing orthodontic therapy. Some studies advocate preservation of the transverse dimension and shape of the dental arch during orthodontic treatment to ensure long-term stability. The desire for maintaining the original dental arch shape, however, is often at odds with the use of preformed archwires of metallic alloys with high elasticity that do not permit adjustments in their shape. This conflict has raised interest in evaluating the optimum dental arch configuration, with the intention to produce optimal preformed archwire shapes.
According to some authors, the dental arch can be described by diagrams constructed from patients’ measurements or diagrams that describe mean curves determined by mathematical equations. Other studies have shown wide variations in dental arch shapes between subjects; this caused authors to search for universal landmarks that might establish an individualized shape for each patient. Such landmarks might be a guide for the construction of customized archwires for the maxillary and mandibular dental arches. To determine this shape, authors recommended the use of reference points on the mandibular alveolar bone ridge.
With this purpose, Andrews and Andrews described an anatomic ridge on the mandibular alveolar process that delimited the soft-tissue band immediately superior to the mucogingival junction. This structure was called the WALA ridge (named after Will Andrews and Larry Andrews who jointly discovered the value of this ridge as a referent for determining the quality of arch shape and archwire shape ridge), and the authors advocated it as a reliable landmark for determining an optimal dental arch shape. The WALA ridge approximates the superoinferior position of the horizontal centers of rotation of teeth in an arch; therefore, this landmark is an adequate guideline for positioning the crowns and roots of teeth over the buccolingual borders of the basal bone.
In a sample of subjects with normal occlusion, Andrews and Andrews analyzed the distances between the dental crowns (facial axis [FA] points) and the WALA ridge, and verified decreased values for this distance from the second permanent molar to the mandibular central incisor. By using these measurements, it would be possible to idealize the archwire shape to place the teeth on the center of the alveolar bone ridge and over supporting basal bone. Ronay et al showed a positive correlation between the FA points and WALA ridge and concluded that the WALA ridge might be useful as a guide for individualized archwire design.
Based on the theory that teeth must be aligned according to an appropriate distance between the corresponding FA points and the WALA ridge, the purpose of this study was to determine the value for this measurement for each tooth in a carefully selected sample of Brazilian subjects with normal occlusion.
Material and methods
Fifty-nine mandibular dental casts of white Brazilians, aged 12 to 21 years, were selected from the files of the postgraduate orthodontic department of Methodist University of São Paulo, Brazil. All patients had permanent dentition, with all teeth in occlusion except for the third molars, had natural normal occlusion, and had no previous orthodontic treatment that could have modified the morphology of the WALA ridge.
The dental casts came from a pool of 6118 patients. Those with at least 4 of the 6 keys to normal occlusion as defined by Andrews were then selected, reducing the sample size to 80. All casts had an ideal interarch relationship (Andrews’ first key ). These 80 casts were then carefully analyzed by 2 examiners (D.F.S., T.T.), and a sample of 59 subjects with all 6 of Andrews’ keys was obtained for this study.
Based on the methodology used previously by Triviño et al, a red glass bead was glued to the buccal aspect of each tooth, simulating the FA point at the center of the clinical crowns of the incisors, canines, and premolars, and at the buccal groove of the molars.
Then, a black glass bead, initially measured (by T.T.) with a pachymeter (Züricher model, Dentaurum, J. P. Winkelstroeter, Ispringen, Germany) to ensure the 2.0-mm diameter, was glued and positioned on the anatomic line of the WALA ridge, adjacent to the FA point ( Fig 1 ).
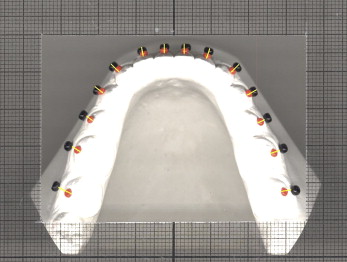
After bonding the glass beads, the dental casts were digitized on a scanner (Scanjet 6100C, Hewlett-Packard, Palo Alto, Calif), and images with 300-dpi resolution in TIFF format were obtained. The correct position of the dental cast on the scanner was established with millimeter paper, especially designed for this methodology, achieved by photocopying a sheet of millimeter paper onto ordinary acetate paper. After making the photocopies, the prepared acetate and millimeter papers were superimposed to verify the lack of distortion on the acetate copy.
A rectangle was cut in the center of the customized acetate paper, a millimeter frame was placed around the dental cast image, and these measurements helped in the reproduction of a 1:1 image ( Fig 1 ). The dental cast was placed in the rectangle’s center, so that the posterior edge of the models would be parallel to the horizontal lines and the middle dental line parallel to the vertical lines.
The arch images of the 59 mandibular dental casts were divided into right and left sides, obtaining 118 semiarches that were projected on a flat computer screen with the software ImageJ (Java, Sun Microsystems, Palo Alto, Calif). With this software, the distances between the red and black glass beads could be calculated, indicating the linear measurements between the FA points and the WALA ridge, and establishing the horizontal relationship of the clinical crowns to the alveolar bone. This distance was measured from a point determined on the inner border of the red glass bead (the border nearest to the buccal aspect of the tooth) to a specific point of the black bead, which was the next glass bead border to the alveolar ridge for the second and first molars and the second premolar. For the first premolars, canines, and incisors, the most external border of the black bead was selected ( Fig 1 ). After obtaining these measurements for the first premolars, canines, and incisors, 2 mm was subtracted from these values, since the measurements included the black glass bead image on these teeth.
Statistical analysis
The mean values of the distance between the FA point and the WALA ridge were calculated based on the arithmetic mean of all distance values of each tooth organized in a table. Then the mean values obtained in this study were compared with Andrews’ data with the Student t test.
The systematic error of our method was measured with a paired t test, and the casual error was calculated with Dahlberg’s formula, which was applied to the results of a second measurement of 20% of the total sample by the same examiner (T.T.).
Results
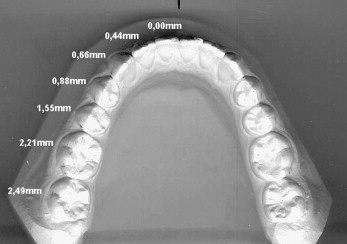
The mean values of the distances between the FA point of the mandibular teeth and the WALA ridge progressively increased from the central incisor to the second permanent molar, from 0.00 to 2.49 mm, respectively ( Fig 2 ).
No statistically significant difference was found between the mean values of our sample and Andrews’ values for the distances of canines and first premolars ( Table I ). Table II gives the results of systematic error with the paired t test and the casual error measured with Dahlberg’s formula of our methodology to determine the distances between the FA point and the WALA ridge.
| Tooth | Mean (n = 59) | SD | Andrews (n = 53) | Difference | t | P |
|---|---|---|---|---|---|---|
| 7 | 2.49 | 0.49 | 2.20 | 0.29 | 6.677 | <0.001 ∗ |
| 6 | 2.21 | 0.44 | 2.00 | 0.21 | 5.412 | <0.001 ∗ |
| 5 | 1.55 | 0.44 | 1.30 | 0.25 | 6.395 | <0.001 ∗ |
| 4 | 0.88 | 0.52 | 0.80 | 0.08 | 1.816 | 0.072 NS |
| 3 | 0.66 | 0.50 | 0.60 | 0.06 | 1.249 | 0.214 NS |
| 2 | 0.44 | 0.53 | 0.30 | 0.14 | 2.957 | 0.004 ∗ |
| 1 | 0.00 | 0.45 | 0.10 | −0.10 | 2.433 | 0.016 ∗ |
Stay updated, free dental videos. Join our Telegram channel
VIDEdental - Online dental courses


