Introduction
The aim of this research was to evaluate esthetic perceptions of the smile, especially regarding black spaces between the maxillary central incisors, by laypersons in 3 age groups.
Methods
Photographs were digitally manipulated to simulate black spaces in the region of the maxillary central incisor crenations. The images were printed on photographic paper and attached to a questionnaire that was given to 150 laypersons in 3 age groups: 15 to 19, 35 to 44, and 65 to74 years. They were asked to use a visual analog scale method to rate the smiles from a score of 0, corresponding to “not very attractive,” to 10, “very attractive.” Differences between the examiners were verified by the Mann-Whitney test. All statistics were performed with a degree of confidence of 95%.
Results
The results showed that older persons had more difficulty perceiving black spaces. In the younger groups, the subjects were better able to perceive the black spaces, and the larger the black space, the less attractive they rated the photograph ( P < 0.01).
Conclusions
Younger people are more likely than older people to perceive black spaces in maxillary incisor crenations. The larger the black spaces, the less attractive they rate the smile.
The appearance of a smile has direct implications for esthetics and facial attractiveness. Among the parts of the face, the eyes play the most important role in esthetics, followed by the mouth—especially when smiling.
Orthodontic literature has given greater emphasis to studies about the dentoskeletal relationship, in spite of the appearance of the smile’s having gained much clinical importance, because frequently it is from this point of view of self-perception that patients also seek to evaluate their treatment. Therefore, the orthodontist’s perception of beauty might differ from the concepts of laypersons about what is attractive and satisfactory.
Quite often, the consequence of orthodontic treatment is the creation of black spaces in the region of the crenations of the maxillary central incisors. These can be the result of an accentuated inclination of the incisors in the mesial direction, bone loss during treatment, or the triangular shape of the maxillary central incisors. These black spaces might cause esthetic alterations, depending on the patient’s self-evaluation.
Pertinent questions arise when black spaces occur at the end of orthodontic treatment. Will these spaces affect the esthetics of the smile? Does age affect the perception of these black spaces? Because the prevalence of black spaces increases with aging as a result of periodontal disease and aging of the periodontium, one could deduce that the older the person, the more tolerant he or she would be of these black spaces.
Based on this premise, we proposed in this study to evaluate the degrees of perception of laypersons in various age groups about the influence of black spaces between the maxillary central incisors on the esthetics of the smile. Subjects with age ranges of 15 to 19, 35 to 44, and 65 to 74 years were used, as recommended by the World Health Organization and International Dental Federation.
Material and methods
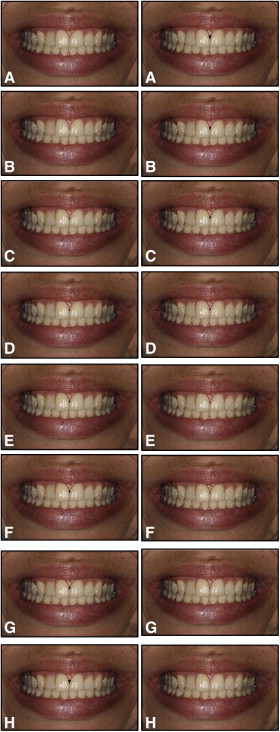
An extraoral photograph of a 30-year-old patient, in normal occlusion, was obtained with a digital camera (Rebel XTI; Canon, Tokyo, Japan). The photograph was cropped to show the lips, teeth, and gingiva to focus attention on the smile. The photograph was manipulated with the Photoshop (CS3; Adobe Systems, San Jose, Calif) computer program to make black spaces of different sizes in the region of the crenations between the maxillary central incisors; the mandibular arch was left intact. This resulted in 8 photographs: 1 had no black spaces, and the others had increasing sizes of black spaces (0.5, 1, 1.5, 2, 2.5, 3, and 3.5 mm). No image showed a deviation of the midline ( Fig ).
The photographs were evaluated by 150 laypersons in 3 age groups: 15 to 19, 35 to 44, and 65 to 74 years. None had received orthodontic treatment. They were asked to complete questionnaires about the images. First, they analyzed a series of miniatures (10 × 6 cm) and chose the most and the least pleasing images. Then a sequence of the images was made, starting with the most pleasing, going to the least. The process was repeated to evaluate the reliability of the evaluation. After this, the evaluators analyzed larger (20 × 12 cm) versions of each image and rated them according to a visual analog scale: 0, not very attractive; 5, attractive; and 10, very attractive. The evaluators were not allowed to make comparisons among the images. All images were placed at a distance of 30 cm from the evaluators’ eyes. One factor for exclusion of an evaluator was lack of visual acuity.
The frequencies of replies by the participants in each age group (15-19, 35-44, and 65-74 years) were compared with the chi-square test. When the expected frequency was less than 5, the Fisher exact test was used. The scores awarded to each photograph were compared with the Kruskal-Wallis test, and comparisons between pairs were performed with the Mann-Whitney test. The means of scores awarded to each photograph were calculated in each group to determine the Spearman correlation coefficients, to evaluate the similarity between perceptions according to the age groups. The level of significance adopted was 5% ( P <0.05). The data were tabulated and analyzed in the statistical program BioEstat (version 5.0; Bioestat, Belém, Pará, Brazil).
Results
Table I shows the demographic data of the study participants. Of the 150 subjects, 60.7% were women.
| Characteristics | Age group (y) | ||
|---|---|---|---|
| 15-19 (n = 49) | 35-44 (n = 51) | 65-74 (n = 50) | |
| Sex | |||
| Male | 21 (42.9%) | 16 (31.4%) | 22 (44.0%) |
| Female | 28 (57.1%) | 35 (68.6%) | 28 (56.0%) |
Table II presents the perceptions of participants with respect to the differences and preferences regarding image 1. There were significant differences in the perceptions of the differences in the photographs, with younger participants more likely to note a lack of similarity between the images than older participants. Among the participants who saw differences between the photographs, there were statistical differences in the proportions among the groups for both the most preferred and the least preferred pictures. The proportion of subjects who liked photograph A most was highest in the age group from 15 to 19 years, followed by the group from 35 to 44 years. The same was observed for the least attractive photograph (photograph H).
| Answer | Age group (y) | P value | ||
|---|---|---|---|---|
| 15-19 | 35-44 | 65-74 | ||
| Perceive differences | <0.001 † | |||
| Yes | 37 (75.5% | 38 (74.5%) | 16 (32.0%) | |
| No | 12 (25.5%) | 13 (25.5%) | 34 (68.0%) | |
| Image I like most ∗ | <0.001 ‡ | |||
| A | 33 (89.2%) | 19 (50.0%) | 7 (43.8%) | |
| B | 0 (0.0%) | 4 (10.5%) | 3 (18.8%) | |
| C | 3 (8.1%) | 3 (7.9%) | 3 (18.8%) | |
| D | 1 (2.7%) | 8 (21.1%) | 0 (0.0%) | |
| E | 0 (0.0%) | 1 (2.6%) | 1 (6.3%) | |
| F | 0 (0.0%) | 0 (0.0%) | 2 (12.5%) | |
| G | 0 (0.0%) | 1 (2.6%) | 0 (0.0%) | |
| H | 0 (0.0%) | 2 (5.3%) | 0 (0.0%) | |
| Image I like least ∗ | 0.024 ‡ | |||
| A | 0 (0.0%) | 1 (2.6%) | 0 (0.0%) | |
| B | 0 (0.0%) | 1 (2.6%) | 1 (6.3%) | |
| C | 0 (0.0%) | 2 (5.3%) | 1 (6.3%) | |
| D | 0 (0.0%) | 1 (2.6%) | 2 (12.5%) | |
| E | 0 (0.0%) | 1 (2.6%) | 0 (0.0%) | |
| F | 0 (0.0%) | 2 (5.3%) | 2 (12.5%) | |
| G | 4 (10.8%) | 5 (13.2%) | 3 (18.8%) | |
| H | 33 (89.2%) | 25 (65.8%) | 7 (43.8%) | |
∗ Answered only by those who perceived differences between the images.
Table III presents the perceptions of the participants with respect to the differences and preferences regarding image 2. The data showed significant differences in the perceptions of the differences in the photographs, with more subjects noting a lack of similarity between the images in the 2 younger age groups. Among the participants who saw differences between the photographs, there were statistical differences in the proportions among the groups for both the most preferred and the least preferred pictures. The proportion of subjects who defined photograph H as the “most attractive” was higher in the age group of 15 to 19 years, followed by the group of 35 to 44 years. The same was observed with regard to photograph A, considered the “least attractive.”
| Answer | Age group (y) | P value | ||
|---|---|---|---|---|
| 15-19 | 35-44 | 65-74 | ||
| Perceive differences | <0.001 † | |||
| Yes | 39 (79.6%) | 34 (66.7%) | 17 (34.0%) | |
| No | 10 (20.4%) | 17 (33.3%) | 33 (66.0%) | |
| Image I like most ∗ | <0.001 ‡ | |||
| A | 1 (2.6%) | 3 (8.8%) | 0 (0.0%) | |
| B | 0 (0.0%) | 2 (5.9%) | 1 (5.9%) | |
| C | 0 (0.0%) | 3 (8.8%) | 0 (0.0%) | |
| D | 0 (0.0%) | 0 (0.0%) | 1 (5.9%) | |
| E | 0 (0.0%) | 0 (0.0%) | 3 (17.6%) | |
| F | 4 (10.3%) | 1 (2.9%) | 5 (29.4%) | |
| G | 2 (5.1%) | 3 (8.8%) | 4 (23.5%) | |
| H | 32 (82.1%) | 22 (64.7%) | 3 (17.6%) | |
| Image I like least ∗ | <0.001 ‡ | |||
| A | 33 (84.6%) | 25 (73.5%) | 2 (11.8%) | |
| B | 1 (2.6%) | 1 (2.9%) | 2 (11.8%) | |
| C | 5 (12.8%) | 2 (5.9%) | 4 (23.5%) | |
| D | 0 (0.0%) | 0 (0.0%) | 3 (17.6%) | |
| E | 0 (0.0%) | 2 (5.9%) | 0 (0.0%) | |
| F | 0 (0.0%) | 1 (2.9%) | 0 (0.0%) | |
| G | 0 (0.0%) | 1 (2.9%) | 2 (11.8%) | |
| H | 0 (0.0%) | 2 (5.9%) | 4 (23.5%) | |
Stay updated, free dental videos. Join our Telegram channel
VIDEdental - Online dental courses


