Introduction
This retrospective cohort study was performed to evaluate the skeletal and dental changes in the short and long terms in hyperdivergent patients treated with rapid maxillary expansion and fixed appliances.
Methods
The sample consisted of 143 patients who had rapid maxillary expansion with a Haas-type expander followed by edgewise therapy. Two groups were established: a normal vertical dimension group (mandibular plane angle >20° and <27°; n = 52) and a hyperdivergent group (mandibular plane angle ≥27°; n = 91). Lateral cephalograms were taken before treatment (average age, 11.5 years in both groups) and after fixed appliance therapy (average age, 14.3 years in both groups). Subjects who exhibited opening or closing in the mandibular plane angle during treatment greater than 1.5° (opening group, n = 23; closing group, n = 26) were followed in the long term (average age, 20.3 years). Longitudinal changes in the different groups were evaluated statistically as well as the prevalence rates of hyperdivergent patients in the opening and closing groups.
Results
No significant differences in treatment effects were found in any sagittal or vertical dentoskeletal variables examined. The long-term evaluation of the patients at 5 or more years posttreatment showed no significant skeletal changes. The prevalence rate of hyperdivergent patients in the opening group was not significant.
Conclusions
The results of this study indicate that rapid maxillary expansion can be carried out successfully in patients with increased vertical dimensions without detrimental effects on the vertical skeletal relationships. Thus, an increased mandibular plane angle is not a contraindication for rapid maxillary expansion therapy.
A hyperdivergent patient with problems in the transverse dimension (eg, posterior crossbite, arch length discrepancy due to narrow arches) is a particular challenge during orthodontic treatment. Fear of creating a negative profile change due to rapid maxillary expansion caused by downward and backward rotation of the mandible can be a major concern to many clinicians when planning treatment for a high-angle patient with maxillary constriction.
The vast majority of the literature on rapid maxillary expansion has documented the sagittal and vertical skeletal effects of expansion in the short term. These studies describe downward movements of the maxilla in response to rapid maxillary expansion that resulted in posterior rotation of the mandible and opening of the mandibular plane angle. These short-term results seemed to indicate that hyperdivergent patients would be affected negatively by rapid maxillary expansion in the vertical dimension. Furthermore, the significance of the findings in some short-term investigations appears to be limited due to the large age range before treatment (Wertz and Dreskin ; ages, 7-29 years), the limited sample sizes (Haas ; n = 4; Inoue et al ; n = 8), and, more generally, the lack of control data.
Investigations on the long-term skeletal changes produced by rapid maxillary expansion found that the opening in the mandibular plane angle is mainly a transient effect of rapid maxillary expansion. However, once again, most of these studies showed some methodologic limitations, since they had small sample sizes or lacked specific analyses of groups of patients with hyperdivergent patterns.
Therefore, the aim of this study was to evaluate the dentoskeletal changes in the short and long terms in a large sample of hyperdivergent patients treated with rapid maxillary expansion and fixed appliances, with the ultimate goal of appraising whether an increased vertical dimension can be a contraindication for rapid maxillary expansion therapy.
Material and methods
The sample analyzed in this retrospective cohort investigation consisted of 143 patients (58 boys, 85 girls) with normal or hyperdivergent vertical skeletal pattern (mandibular plane angle >20° at an average age of 11 years). All patients underwent maxillary expansion with a Haas expander and were treated in the same private practice. Lateral cephalograms of good quality were taken of all patients at 2 time points (pretreatment [T1] and after fixed appliance treatment [T2]) and, for a more limited sample of 49 subjects, also at a posttreatment long-term observation (T3, more than 5 years posttreatment). The average ages were 11.4 years ± 1.2 years at T1, 14.3 years ± 1.1 years at T2, and 20.1 years ± 1.6 years at T3.
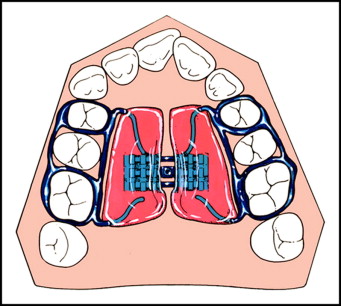
The patients from the private practice of Drs Robert and Thomas Herberger of Elyria, Ohio, enrolled in the clinical trial had a nonextraction treatment protocol incorporating rapid maxillary expansion with a Haas-type maxillary expander ( Fig 1 ) turned twice per day at 0.25 mm per turn until the expansion screw reached 10.5 mm. As reported elsewhere, the average amount of maxillary deficiency at the level of the first permanent molars was 6 to 7 mm. The standardized expansion of 10.5 mm took into account the expected average postexpansion relapse tendency of about 30%. The Haas expander was kept in place after active expansion for an average of 65 days for retention. Full fixed orthodontic appliances were placed immediately after the removal of the Haas-type rapid maxillary expansion. No further active expansion was obtained during the fixed appliance phase and no adjuncts (eg, headgears or chincups) other than intermaxillary elastics were used at any time.
An attempt was made to recall all patients who had the treatment protocol described above. One hundred forty-three patients agreed to have follow-up records taken at about the age of 20 years. This sample of patients, followed for 5 or more years after active treatment, can be considered a type of “consecutively treated” patient sample, in that treatment outcome was not a basis for patient selection.
In the cephalometric analysis, serial films for a subject were traced in 1 sitting by 1 investigator (M.W.L.) and then verified for anatomic contour and landmark identification and tracing superimpositions by a second investigator (J.A.M.).
Regional superimpositions in each series were accomplished by hand, as previously advocated by Ricketts and McNamara, and in accordance with the findings of the implant study of Björk and Skieller. Maxillary and mandibular fiducial markers used for this purpose were placed on the T2 tracing and then carried through to the T1 and T3 tracings (when appropriate) in a series by way of maxillary and mandibular regional superimpositions, respectively.
Tracings of the lateral cephalograms were digitized by using a digitizing device (Numonics, Landsdale, Pa) and digitizing software (DFP Plus 2.02; Dentofacial Software, Toronto, Ontario, Canada). From the digitized tracings, 25 measurements were generated for each patient at each time point. All lateral cephalograms had a magnification from 6% to 8%. To standardize the data, all linear measurements were converted to 8% enlargement.
The subjects were analyzed at T1, T2, and T3 with the cervical vertebral maturational method, a reliable way to assess skeletal maturity, as described by Baccetti et al. Blinded to the patient’s age, 2 evaluators (T.B. and L.F.) experienced in the cervical vertebral maturational method determined each patient’s stage. Any discrepancies between the 2 evaluators were resolved by a third experienced investigator (J.A.M.).
Statistical analysis
Means and standard deviations were calculated for all cephalometric measures at the different time points. Based on the initial mandibular plane angles, the subjects were first divided into 2 groups: a normal group (mandibular plane angle >20° and <27°) and a hyperdivergent group (mandibular plane angle ≥27°). The average ages for the normal group were 11.5 ± 1.1 years at T1, and 14.3 ± 1.2 years at T2. The average ages for the hyperdivergent group were 11.4 ± 1.2 years at T1, and 14.3 ± 1.1 years at T2.
An exploratory Shapiro-Wilks test was performed on all variables to test the normality of the samples, and a Levene test was performed to evaluate the equality of variances. The results were not significant and indicated normality of distribution and equality of variances for the examined parameters; therefore, parametric statistics were recommended. The Student t test was used to compare statistically the starting forms at T1 and the changes observed from T1 to T2 between the normal and hyperdivergent groups.
The hyperdivergent group then was divided further into 2 groups: moderately hyperdivergent (mandibular plane angle ≥27° and <32°) and very hyperdivergent (mandibular plane angle ≥32°). The average ages for the moderately hyperdivergent group were 11.4 ± 1.1 years at T1, and 14.3 ± 1.0 years at T2. The average ages for the very hyperdivergent group were 11.3 ± 1.4 years at T1, and 14.2 ± 1.3 years at T2. Analysis of variance (ANOVA) with the Tukey post-hoc test was used to compare statistically the starting forms at T1, and the T1 to T2 changes in the 3 groups (normal vs moderately hyperdivergent vs very hyperdivergent).
After the analysis of the treatment effects observed in the first 2 headfilms (T2-T1), the patients were stratified into 2 subgroups on the basis of changes in mandibular plane angles during treatment. This further analysis aimed to evaluate the changes in mandibular plane angles as a result of the patients’ responses to treatment in addition to their vertical characteristics at T1. The closing group would comprise patients who had a substantial closure (more negative than –1.5°) of the mandibular plane angle from T1 to T2, whereas the opening group would comprise patients who from T1 to T2 experienced a substantial opening of the mandibular plane angle more positive than 1.5°. The value of 1.5° was chosen based on the method error for the mandibular plane angle measure (about 1°). The prevalence rate of hyperdivergent subjects was calculated in the 2 subgroups and compared by using a z-test on proportions. Lastly, the closing and opening groups were followed for the T3 observation of at least 5 years after the end of fixed appliances (average age, 20.3 years). The posttreatment (T2-T3) changes in the opening and closing groups were compared with the Student t test. Statistical significance was tested at the P <0.05 level for all statistical tests, performed with statistical software (SPSS for Windows, version 12; SPSS, Chicago, Ill; SigmaStat version 3.5; Systat Software, Point Richmond, Calif).
The power of the study was calculated on the basis of the sample size of the groups and the effect size equal to 1, and it was greater than 0.90 for all comparisons. Thirty subjects from the sample were selected at random. All films were retraced and redigitized, and cephalometric variables were reassessed. Intraclass correlation coefficients were calculated to compare within-subject variability with between-subjects variability. Correlation coefficients for the cephalometric measures were extremely high; all correlation coefficients were greater than 0.985. The errors in measurements for both linear and angular variables were within 1.2 mm and 1.2°, respectively.
Results
All groups (normal, hyperdivergent, and very hyperdivergent) were well matched with regard to skeletal maturity. Most subjects were in a prepubertal stage of development (CS 1-3) at T1 and in a postpubertal stage of development (CS 4-6) at T2. All subjects were fully mature (CS 6) at T3.
Descriptive statistics for the normal and hyperdivergent groups at T1 are presented in Table I . In the normal group, the average mandibular plane angle value was 24.0° ± 2.0°; the hyperdivergent group had a mandibular plane angle of 31.0° ± 3.0° ( Table II ). Lower anterior facial height, measured from ANS to menton, was longer in the hyperdivergent group than in the normal group (+2.3 mm). Posterior facial height, the distance from condylion to gonion, was significantly shorter in the hyperdivergent group (–4.4 mm), indicating that decreased posterior facial height in the hyperdivergent group was a significant factor in the steepness of the mandibular plane angle. The gonial angle also was greater in the hyperdivergent group than in the normal group (+6.3°). No differences in the angle between the palatal plane and the Frankfort horizontal or in upper facial height (Na-ANS) were noted ( Table I ).
| Cephalometric measurement | Hyperdivergent (n = 91) | Normal (n = 52) | Difference | P value ( t test) |
||
|---|---|---|---|---|---|---|
| Mean | SD | Mean | SD | |||
| Cranial base | ||||||
| Ba-S-N (°) | 129.0 | 4.7 | 127.9 | 4.2 | +1.1 | 0.151 |
| Maxillary AP skeletal | ||||||
| SNA (°) | 79.0 | 3.0 | 80.6 | 2.9 | −1.6 | ∗ |
| Co-Point A (mm) | 86.6 | 3.6 | 89.5 | 4.5 | −2.9 | † |
| Point A-Na perp (mm) | −1.9 | 2.8 | −0.3 | 2.6 | −1.6 | ∗ |
| Mandibular AP skeletal | ||||||
| SNB (°) | 75.7 | 2.7 | 77.6 | 2.6 | −1.9 | † |
| Co-Gn (mm) | 111.3 | 5.4 | 113.8 | 5.8 | −2.5 | ‡ |
| Pg to Na perp (mm) | −8.6 | 4.1 | −4.3 | 3.9 | −4.3 | † |
| Intermaxillary | ||||||
| ANB (°) | 3.3 | 2.3 | 3.0 | 1.8 | +0.3 | 0.360 |
| Maxillomandibular difference (mm) | 24.8 | 4.1 | 24.3 | 3.7 | +0.5 | 0.518 |
| Wits appraisal (mm) | −1.2 | 2.8 | −0.4 | 2.5 | −0.8 | 0.102 |
| Vertical skeletal | ||||||
| FH to PP (°) | 0.6 | 3.0 | 1.1 | 3.0 | −0.5 | 0.285 |
| MPA (°) | 31.0 | 3.0 | 24.0 | 2.0 | +7.0 | † |
| Go angle (°) | 131.2 | 5.3 | 124.9 | 4.4 | +6.3 | † |
| N-ANS (mm) | 51.2 | 3.3 | 51.0 | 3.5 | +0.2 | 0.840 |
| ANS-Me (mm) | 67.3 | 4.5 | 65.0 | 5.0 | +2.3 | ∗ |
| Co-Go (mm) | 47.8 | 3.6 | 52.2 | 4.1 | −4.4 | † |
| Interdental | ||||||
| Overbite (mm) | 3.3 | 1.9 | 3.5 | 1.9 | −0.2 | 0.584 |
| Overjet (mm) | 5.3 | 1.8 | 4.7 | 2.0 | +0.6 | 0.070 |
| Interincisal angle (°) | 130.4 | 8.0 | 129.5 | 9.1 | +0.9 | 0.523 |
| Molar relation (mm) | 1.6 | 1.4 | 1.4 | 1.3 | +0.2 | 0.427 |
| Dentoalveolar | ||||||
| U1-Point A vert (mm) | 4.3 | 1.6 | 4.7 | 1.2 | −0.4 | 0.135 |
| IMPA (°) | 87.5 | 5.3 | 93.1 | 5.6 | −5.6 | † |
| Soft tissue | ||||||
| Upper lip to E-line (mm) | −3.0 | 2.3 | −3.1 | 2.4 | +0.1 | 0.840 |
| Lower lip to E-line (mm) | 0.1 | 2.4 | −0.7 | 2.3 | +0.8 | 0.050 |
| NL angle (°) | 115.7 | 12.7 | 114.1 | 13.8 | +1.6 | 0.476 |
| Cephalometric measurement | Hyperdivergent (n = 91) | Normal (n = 52) | Difference | P value ( t test) | ||
|---|---|---|---|---|---|---|
| Mean | SD | Mean | SD | |||
| Cranial base | ||||||
| Ba-S-N (°) | 0.1 | 1.6 | −0.1 | 1.6 | +0.2 | 0.707 |
| Maxillary AP skeletal | ||||||
| SNA (°) | −0.5 | 1.4 | −0.4 | 1.3 | −0.1 | 0.681 |
| Co-Point A (mm) | 2.6 | 1.5 | 2.7 | 1.7 | −0.1 | 0.896 |
| Point A-Na perp (mm) | −0.8 | 1.4 | −0.6 | 1.3 | −0.2 | 0.331 |
| Mandibular AP skeletal | ||||||
| SNB (°) | 0.1 | 1.5 | 0.2 | 1.3 | −0.1 | 0.647 |
| Co-Gn (mm) | 7.0 | 3.1 | 6.1 | 2.4 | +0.9 | 0.065 |
| Pg to Na perp (mm) | 0.1 | 2.7 | 0.5 | 2.3 | −0.4 | 0.301 |
| Intermaxillary | ||||||
| ANB (°) | −0.6 | 1.5 | −0.6 | 1.1 | 0.0 | 0.980 |
| Maxillomandibular difference (mm) | 4.4 | 2.9 | 3.4 | 2.4 | +1.0 | 0.052 |
| Wits appraisal (mm) | 1.4 | 2.9 | 0.7 | 2.3 | +0.7 | 0.150 |
| Vertical skeletal | ||||||
| FH to PP (°) | −0.6 | 1.6 | −0.5 | 1.6 | −0.1 | 0.620 |
| MPA (°) | 0.3 | 1.8 | 0.0 | 1.8 | +0.3 | 0.424 |
| Go angle (°) | −1.5 | 2.4 | −0.7 | 3.6 | −0.8 | 0.099 |
| N-ANS (mm) | 3.3 | 1.6 | 2.9 | 1.6 | +0.4 | 0.162 |
| ANS-Me (mm) | 4.3 | 2.4 | 3.7 | 2.4 | +0.6 | 0.150 |
| Co-Go (mm) | 3.8 | 2.5 | 3.3 | 3.9 | +0.5 | 0.332 |
| Interdental | ||||||
| Overbite (mm) | −1.8 | 1.8 | −2.1 | 1.9 | +0.3 | 0.425 |
| Overjet (mm) | −1.9 | 3.6 | −1.5 | 1.6 | −0.4 | 0.417 |
| Interincisal angle (°) | −13.3 | 17.0 | −10.0 | 10.3 | −3.3 | 0.205 |
| Molar relation (mm) | 1.0 | 2.0 | 1.1 | 1.3 | −0.1 | 0.732 |
| Dentoalveolar | ||||||
| U1-Point A vert (mm) | 0.4 | 3.5 | 0.3 | 1.3 | +0.1 | 0.869 |
| IMPA (°) | 7.1 | 5.5 | 5.8 | 5.5 | +1.3 | 0.182 |
| Soft tissue | ||||||
| Upper lip to E-line (mm) | −1.3 | 1.6 | −1.6 | 2.0 | +0.3 | 0.253 |
| Lower lip to E-line (mm) | −0.1 | 1.7 | −0.5 | 2.3 | +0.4 | 0.194 |
| NL angle (°) | −0.1 | 12.1 | −1.0 | 12.2 | +0.9 | 0.697 |
The common observation that could be made in the sagittal starting form was the relative retrusion of both the maxilla and the mandible in the hyperdivergent group compared with the normal group. When the sagittal position of the maxilla relative to the mandible was evaluated, however, no differences between the 2 groups were noted.
Similarly, there were no differences in interdental relationships, including overbite, overjet, molar relationship, and interincisal angle. The only significant dental measurement was the relationship of the mandibular incisor to the mandibular plane (IMPA). The mandibular incisor was significantly more upright (–5.6°) in the hyperdivergent group with respect to the normal group. There were no significant differences in the 3 soft-tissue measurements evaluated.
No significant differences were found for any dentoskeletal or soft-tissue variables examined from T1 to T2 ( Table II ). Of particular interest were the changes in the mandibular plane relative to the Frankfort horizontal plane. The mandibular plane angle opened by only 0.3° ± 1.8° in the hyperdivergent group; the same angle in the normal group on average remained unchanged (0.0° ± 1.8°).
The average mandibular plane angle in the moderately hyperdivergent group was 29.3° ± 1.4°; the same angle in the very hyperdivergent group was 34.7° ± 2.0°; the mandibular plane angle of the normal group remained at 24.0° ± 2.0° ( Table III ). Lower anterior facial height was 2.8 mm longer in the very hyperdivergent group than in the moderately hyperdivergent group, a difference that was statistically significant. There was no difference in posterior facial height (Co-Gn) between the 2 hyperdivergent groups, although the measurement was statistically longer in both groups than in the normal group. No differences among groups were seen in upper facial height. The gonial angle in the very hyperdivergent group was 5.4° greater than that of the moderately hyperdivergent group and 10° greater than the gonial angle of the normal group.
| Cephalometric measurement | Hyperdivergent (n = 62) | Very hyperdivergent (n = 29) | Normal (n = 52) | ANOVA P value |
Statistical comparisons | |||||
|---|---|---|---|---|---|---|---|---|---|---|
| Mean | SD | Mean | SD | Mean | SD | H vs VH | H vs N | VH vs N | ||
| Cranial base | ||||||||||
| Ba-S-N (°) | 129.2 | 4.7 | 128.6 | 4.8 | 127.9 | 4.2 | 0.296 | NS | NS | NS |
| Maxillary AP skeletal | ||||||||||
| SNA (°) | 79.2 | 2.9 | 78.7 | 3.3 | 80.6 | 2.9 | 0.010 | NS | ∗ | ∗ |
| Co-Point A (mm) | 86.6 | 3.3 | 86.4 | 4.3 | 89.5 | 4.5 | 0.000 | NS | ∗ | ∗ |
| Point A-Na perp (mm) | −1.7 | 2.9 | −2.1 | 2.6 | −0.3 | 2.6 | 0.005 | NS | ∗ | NS |
| Mandibular AP skeletal | ||||||||||
| SNB (°) | 76.2 | 2.5 | 74.7 | 3.0 | 77.6 | 2.6 | 0.000 | ∗ | ∗ | ∗ |
| Co-Gn (mm) | 111.3 | 4.8 | 111.4 | 6.5 | 113.8 | 5.8 | 0.051 | NS | NS | NS |
| Pg to Na perp (mm) | −7.5 | 3.9 | −11.1 | 3.4 | −4.3 | 3.9 | 0.000 | ∗ | ∗ | ∗ |
| Intermaxillary | ||||||||||
| ANB (°) | 3.0 | 2.2 | 4.1 | 2.3 | 3.0 | 1.8 | 0.051 | NS | NS | NS |
| Maxillomandibular difference (mm) | 24.7 | 4.0 | 25.0 | 4.3 | 24.3 | 3.7 | 0.763 | NS | NS | NS |
| Wits appraisal (mm) | −1.1 | 2.8 | −1.4 | 2.9 | −0.4 | 2.5 | 0.245 | NS | NS | NS |
| Vertical skeletal | ||||||||||
| FH to PP (°) | 0.9 | 2.8 | −0.2 | 3.3 | 1.1 | 3.0 | 0.155 | NS | NS | NS |
| MPA (°) | 29.3 | 1.4 | 34.7 | 2.0 | 24.0 | 2.0 | 0.000 | ∗ | ∗ | ∗ |
| Go angle (°) | 129.5 | 4.8 | 134.9 | 4.4 | 124.9 | 4.4 | 0.000 | ∗ | ∗ | ∗ |
| N-ANS (mm) | 50.8 | 3.1 | 51.9 | 3.5 | 51.0 | 3.5 | 0.370 | NS | NS | NS |
| ANS-Me (mm) | 66.4 | 4.2 | 69.2 | 4.6 | 65.0 | 5.0 | 0.001 | ∗ | NS | ∗ |
| Co-Go (mm) | 48.3 | 3.5 | 46.7 | 3.7 | 52.2 | 4.1 | 0.000 | NS | ∗ | ∗ |
| Interdental | ||||||||||
| Overbite (mm) | 3.3 | 1.9 | 3.3 | 2.0 | 3.5 | 1.9 | 0.845 | NS | NS | NS |
| Overjet (mm) | 5.1 | 1.7 | 5.8 | 2.0 | 4.7 | 2.0 | 0.046 | NS | NS | ∗ |
| Interincisal angle (°) | 130.5 | 8.1 | 130.4 | 8.1 | 129.5 | 9.1 | 0.814 | NS | NS | NS |
| Molar relation (mm) | 1.6 | 1.5 | 1.6 | 1.2 | 1.4 | 1.3 | 0.727 | NS | NS | NS |
| Dentoalveolar | ||||||||||
| U1-Point A vert (mm) | 4.6 | 1.6 | 3.9 | 1.8 | 4.7 | 1.2 | 0.035 | NS | NS | ∗ |
| IMPA (°) | 88.7 | 5.3 | 85.1 | 4.6 | 93.1 | 5.6 | 0.000 | ∗ | ∗ | ∗ |
| Soft tissue | ||||||||||
| Upper lip to E-line (mm) | −3.1 | 2.5 | −2.8 | 1.9 | −3.1 | 2.4 | 0.880 | NS | NS | NS |
| Lower lip to E-line (mm) | −0.1 | 2.5 | 0.5 | 2.3 | −0.7 | 2.3 | 0.085 | NS | NS | NS |
| NL angle (°) | 114.3 | 13.8 | 118.6 | 9.4 | 114.1 | 13.8 | 0.271 | NS | NS | NS |
A similar pattern of maxillary and mandibular skeletal retrusion relative to the cranial base was noted as the mandibular plane angle increased ( Table III ). The maxilla was more retruded in both hyperdivergent groups compared with the normal group, but they were not different from one another. There were no differences in any of the 3 intermaxillary measures considered. No significant differences were noted in any dental measurements, except for IMPA, which was significantly smaller in both hyperdivergent groups. No differences were noted in any of the 3 soft-tissue measurements considered.
Similar to the comparison between the overall hyperdivergent and normal groups, no significant differences were found for any dentoskeletal or soft-tissue variables examined from T1 to T2 for the 3 groups ( Table IV ).


