Introduction
The primary aim of this study was to better understand how bone adapts to forces applied to miniscrew implants. A secondary aim was to determine whether the direction of force applied to miniscrew implants has an effect on bone surrounding the miniscrew implants.
Methods
A randomized split-mouth design, applied to 6 skeletally mature male foxhound dogs, was used to compare miniscrew implants loaded for 9 weeks with 200 or 600 g to unloaded control miniscrew implants. By using microcomputed tomography, with an isotropic resolution of 6 μm, bone volume fractions (bone volume/total volume) were calculated for bone around the entire miniscrew implant surface. Bone volume fractions were calculated for bone 6 to 24, 24 to 42, and 42 to 60 μm from the miniscrew implant surface. For each loaded miniscrew implant, the bone volume fraction was also calculated for 2 compression and 2 noncompression zones.
Results
The 6 to 24-μm layer showed a significantly lower ( P <0.05) bone volume fraction than did the 24 to 42-μm and the 42 to 60-μm layers, which were not significantly different. The bone volume fractions of cortical bone surrounding the apical aspects of the unloaded miniscrew implants were significantly greater ( P <0.05) than the bone volume fractions of cortical bone surrounding the loaded miniscrew implants. In contrast, the bone volume fractions of noncortical bone surrounding loaded miniscrew implants were significantly greater ( P <0.05) than the bone volume fractions of bone surrounding the unloaded miniscrew implants. Miniscrew implants loaded with 200 g showed significantly greater ( P <0.05) amounts of noncortical bone volume fractions than did miniscrew implants loaded with 600 g. With both 200 and 600 g, zones under compression had significantly greater bone volume fractions than did the noncompression zones.
Conclusions
The application of force, the amount of force applied, and the direction of force all have significant effects on the amounts of bone produced around miniscrew implants.
Miniscrew implants provide skeletal anchorage with minimal need for patient compliance. Their small size makes them easy to place in numerous locations and easy to remove; miniscrew implants have proven to be versatile in clinical applications. Despite their many advantages, the survival rates of miniscrew implants have yet to achieve those of endosseous dental implants. A recent systematic review showed that, of 2374 miniscrews (31 different types) placed, 363 failed, resulting in a survival rate of 84.7%. For miniscrew implants to be stable in the long term, they must be stable immediately after placement. Movement of miniscrew implants during early wound healing is considered to be a high risk factor for early implant loss. Endosseous dental implants have shown that secondary stability—when healing takes place—is responsible for osseointegration of the implant.
Our understanding of how bone responds to loading is based primarily on long bones loaded with heavy, intermittent forces. With respect to the dentoalveolar complex, most studies pertain to axial loading of endosseous dental implants and show definite effects of the forces. However, miniscrew implants place much lighter, continuous loads on dentoalveolar bone that are transaxial by nature. Because of the differences in type, amount, and direction of the load, research pertaining to dental implants might not apply to miniscrew implants.
Studies comparing differences between 2 known forces have suggested that osseointegration is independent of force magnitudes applied to miniscrew implants. Studies comparing an applied force with no force have also shown no significant histologic differences in bone caused by miniscrew implants. Importantly, all of the aforementioned studies evaluated the effects of force on osseointegration with histomorphometry, which provides only 2-dimensional information for a small portion of the screw. A recent study with microcomputed tomography showed significantly greater bone volume fraction (bone volume/total volume) around loaded miniscrew implants than unloaded miniscrew implants, especially in the noncortical regions. These findings suggest that microcomputed tomography might be more sensitive than histomorphometry for evaluating the effects of force on bony adaptations around miniscrew implants.
The primary aim of this study was to evaluate with microcomputed tomography the effects of force and force amount on bony adaptations around miniscrew implants. A secondary aim was to determine whether bone around miniscrew implants subjected to compressive loads adapts differently than does bone around unloaded miniscrew implants.
Material and methods
Six skeletally mature male foxhounds, 1 to 2 years old and weighing between 55 and 65 pounds, were used for this study. The Institutional Animal Care and Use Committee at Baylor College of Dentistry, Dallas, Tex, approved the care of the animals and the experimental protocols. Foxhounds are an established model for investigating peri-implant osseous dynamics; their large mandibles provide the spaces between miniscrew implants necessary for loading.
The miniscrew implants (IMTEC, Ardmore, Okla) used were self-drilling, made of titanium alloy, and measured 6 mm long and 1.8 mm wide (outer diameter). Each animal had 5 (4 loaded and 1 unloaded) miniscrew implants placed in the interradicular and interdental areas of the first and second mandibular molars, with most having been placed in unattached gingiva. By using random assignment, the experimental miniscrew implants on 1 side were loaded with 200 g, and those on the other side were loaded with 600 g. The unloaded miniscrew implant was also randomly assigned to 1 side or the other.
On the day of placement, all animals were sedated with ketamine (2.2 mg/kg, intramuscularly) and rompin (0.22 mg/kg, intramuscularly) and given a prophylaxis with ultrasonic scaling instrumentation. Radiographic stents were placed, and periapical radiographs were taken bilaterally to determine miniscrew implant placement locations ( Fig 1 , A ). The radiographic stents were replaced and used as guides to ensure accuracy of miniscrew implant placement. All 30 miniscrew implants were placed in buccal alveolar bone perpendicular to the cortical plate or parallel to the occlusal plane. The miniscrew implants were placed in the bifurcations of the first and second molars. Height and exact anteroposterior locations of placement were measured and determined from periapical radiographs. Unloaded miniscrew implants were placed approximately 4 mm apical to their loaded counterparts. Placement sites were marked and prepared with a 1.5-mm tissue punch, and pilot holes were drilled by using a 1.1-mm surgical drill under copious irrigation.
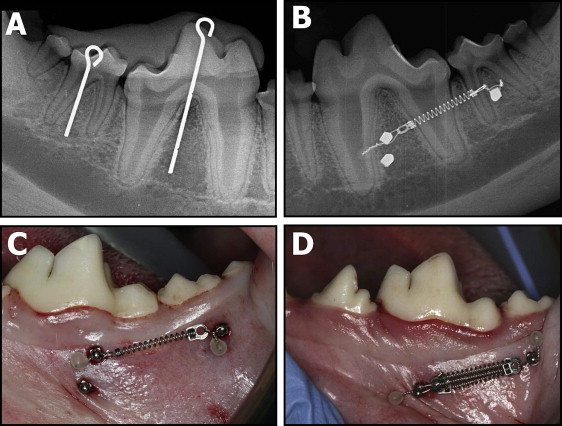
The miniscrew implants were loaded with 200-g nickel-titanium coil springs (Dentsply GAC, Bohemia, NY) tied through the islets on the heads of the implants with a 0.010-in stainless steel ligature wire ( Fig 1 , B ). Three 200-g coil springs placed in parallel were used to load the miniscrew implants with 600 g ( Fig 1 , C ). The activation forces of the coil springs were measured with a Correx Gram Force Gauge (Long Island Indicator Service, Hauppauge, NY). Postoperative peri-implant sites were irrigated with 0.2% chlorhexidine, and periapical radiographs were taken bilaterally to ensure proper miniscrew implant positioning. Both analgesics (torbugesic, 0.2 mg/kg [2 mg/mL with 1 mL per animal]) and antibiotics (penicillin G, 60,000 units/kg) were administered. Inspection of appliance condition and prophylaxis with a toothbrush and 0.2% chlorhexidine irrigant were performed weekly.
Nine weeks after miniscrew implant placement, the animals were killed with a 2-mL intracardiac injection of Beuthanasia-D and perfused with 1 to 2 L of normal saline solution, followed by 1 L of 70% ethanol. The mandibles were resected en bloc and stored in 70% ethanol in preparation for the microcomputed tomography evaluations. Each hemi-jaw was sectioned to include both the experimental and the unloaded miniscrew implants.
Each bone-implant sample was retrieved with a modified 10-mm diameter trephine bur (ACE Dental Implant System, Brockton, Mass) under copious irrigation. The samples were sectioned parallel to the long axis of the implant, ensuring that all 3 layers of the bone (cortical, medullary, and cortical) remained intact and undamaged, and stored in 70% ethanol.
A wet grindstone was used to smooth the outer edges of the bone-implant specimens to ensure a precise fit into the cylindrical (9.8-mm internal diameter) sample holders. A maximum of 3 bone-implant specimens were placed in each holder, along with 70% ethanol. The samples were then radiographically evaluated by using microcomputed tomography (35; Scanco Medical, Basserdorf, Switzerland) with an isotropic resolution of 6 μm. X-ray energy levels were set to 70 kVp, current to 114 μA, and integration time to 800 ms. A 0.5-mm aluminum filter and a high resolution setting of 1000 projections per 180° were used to ensure the highest quality scans with minimal metal implant artefacts.
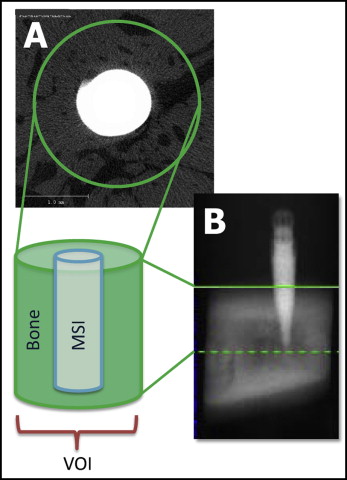
For the 360° analysis of the entire miniscrew implant, a volume of interest for each specimen was defined as 430 pixels in diameter with the implant positioned in the center ( Fig 2 , A ). The specific design of the implant required the apical limit of the volume of interest to be set to 10 slices (0.06 mm) coronally from the miniscrew implant’s tip ( Fig 2 , B ). The coronal limit of the volume of interest was visually defined as the slice at which bone was observed to completely surround and contact the miniscrew implant. The average scanning time was 3.2 hours per specimen.
Based on the original gray-scale images, threshold values that produced the best representations of the miniscrew implants, mineralized bone, and background were determined. Three-dimensional reconstructions were generated by using the threshold values. The reconstructions of each specimen were divided into a cortical region, which included only cortical bone, and a noncortical region, which included mostly trabecular bone and limited amounts of cortical bone ( Fig 3 ).
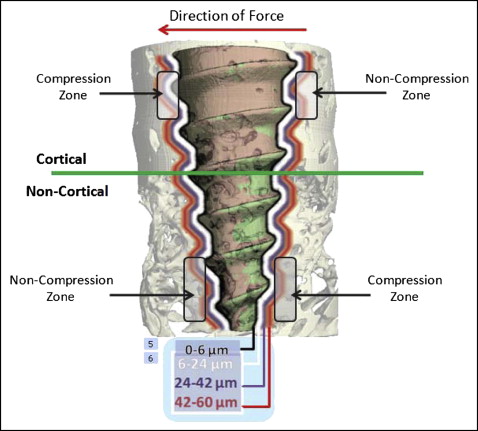
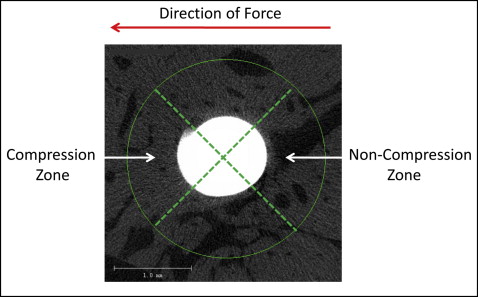
For each specimen, separate bone volume fractions were calculated for the cortical and noncortical regions. Bone volume fraction measures the relative amount of bone per unit of volume; for example, a bone volume fraction ratio of 0.6 indicates 60% bone and 40% space, or nonbone. The analyses pertained to 3 layers of bone, 6 to 24, 24 to 42, and 42 to 60 μm from the miniscrew implant’s surface ( Fig 4 ). A previous microcomputed tomography study demonstrated the loading effects on the first 2 layers of bone; the third layer was added in our study to more precisely determine the limit of the loading effects. Each layer included 3 voxels (volumetric 3-dimensional pixel), each 6 μm thick. The first voxel (ie, from 0 to 6 μm from the miniscrew implant) was not included because it contained most of the metallic halation artefacts. For the comparisons of the compression and noncompression zones, the calculated areas of interest included the 6 to 24-μm and the 24 to 42-μm layers. The 42 to 60-μm layer was not evaluated because preliminary analysis showed no differences between the outer 2 layers of bone.
Four 3-dimensional zones around each miniscrew implant were evaluated to determine whether and how the direction of applied force influenced the bone. Based on the experimental and clinical evidence showing that miniscrew implants tip with immediate orthodontic loading, 2 compression and 2 noncompression zones were digitally created in the same plane of force application. To create reproducible and standardized zones of interest, the cortical and noncortical regions of the volume of interest were digitally divided into 4 equal 90° pie-shaped zones ( Fig 4 ). Because of the tapered geometry of the miniscrew implants, different vertical limits were used to create zones with comparable volumes of bone.
Statistical analysis
The bone surrounding the cortical and noncortical regions of the miniscrew implants was evaluated separately. Each region included variable numbers of slices, ranging between 196 and 326 slices for the cortical region and 292 and 521 slices for the noncortical region. To make comparisons across the regions, the relative positions of the slices in each region were standardized by dividing each slice number by the total number of slices. This produced the relative position of each slice in each region ranging from 1% to 100%, with 1% and 100% representing the most coronal and apical slices, respectively.
Multilevel statistical models were used to determine the changes between slices in each region, as well as to evaluate the differences between the unloaded, 200-g, and 600-g groups. The models were developed with software (MLwiN; Center for Multilevel Modeling, Institute of Education, London, United Kingdom) using iterative generalized least squares. The preliminary analysis of the changes of bone volume fractions in both the cortical and noncortical regions were best described by a simple linear regression model. The intercept term described the bone volume fraction at the most coronal slice of each region (ie, 0% relative thickness); the slope described the changes in bone volume fractions for each percent of change of relative slice thickness. For these analyses, 2-level models were used, with random variations partitioned between specimens and between slice numbers, within specimens.
Multilevel models were also used to describe and compare the compression and noncompression zones. Separate analyses were performed for the cortical and noncortical regions, as well as for the 6 to 24-μm and 24 to 42-μm layers. Two-level models were used to partition random variations between specimens and between zones in each specimen.
Multilevel modeling procedures were used because they make no assumptions as to the equality of the intervals used for the independent variable. Multilevel procedures made it possible to easily determine the appropriate curves to use to describe the changes in bone volume fractions in a region and simultaneously evaluate group differences.
Results
For all miniscrew implants, the cortical regions showed significantly ( P <0.05) greater amounts of bone than did the noncortical regions. All regions showed significant decreases in bone volume fractions between the most coronal and apical aspects of each region, with the exception of the 6 to 24-μm layer in the cortical region of the unloaded miniscrew implants. The decreases were significantly greater in the noncortical regions than in the cortical regions ( Tables I and II ; Fig 5 ).
| Control | 200 g | Group difference | ||||||||||
|---|---|---|---|---|---|---|---|---|---|---|---|---|
| Intercept | SE | Slope | SE | Intercept | SE | Slope | SE | Intercept | SE | Slope | SE | |
| Cortical bone | ||||||||||||
| 6-24 μm | 5.554e-1 | 3.928e-2 | 6.090e-5 | 8.285e-5 | 5.952e-1 | 5.039e-3 | −1.201e-3 | 8.704e-5 | 4.502e-2 | 4.806e-2 | −1.063e-3 | 9.622e-5 |
| 24-42 μm | 9.893e-1 | 2.330e-2 | −1.366e-4 | 5.689e-5 | 9.806e-1 | 3.323e-3 | −5.582e-4 | 5.741e-5 | −4.486e-3 | 2.849e-2 | −4.225e-4 | 6.610e-5 |
| 42-60 μm | 9.853e-1 | 2.179e-2 | −1.560e-4 | 5.662e-5 | 9.813e-1 | 3.189e-3 | −5.452e-4 | 5.509e-5 | 2.566e-4 | 2.665e-2 | −3.901e-4 | 6.575e-5 |
| Noncortical bone | ||||||||||||
| 6-24 μm | 5.224e-1 | 3.559e-2 | −3.202e-3 | 8.085e-5 | 4.340e-1 | 5.819e-3 | −9.740e-4 | 1.006e-4 | −1.040e-1 | 6.894e-3 | 2.227e-3 | 1.017e-4 |
| 24-42 μm | 9.945e-1 | 3.521e-2 | −3.944e-3 | 9.119e-5 | 8.875e-1 | 5.609e-3 | −1.735e-3 | 9.696e-5 | −1.339e-1 | 7.773e-3 | 2.208e-3 | 1.147e-4 |
| 42-60 μm | 9.937e-1 | 3.636e-2 | −4.048e-3 | 9.841e-5 | 8.927e-1 | 5.916e-3 | −1.967e-3 | 1.023e-4 | −1.299e-1 | 8.388e-3 | 2.080e-3 | 1.237e-4 |
∗ Intercept (at 0% relative region thickness) + (slope · % relative region thickness).
| Control | 600 g | Group difference | ||||||||||
|---|---|---|---|---|---|---|---|---|---|---|---|---|
| Intercept | SE | Slope | SE | Intercept | SE | Slope | SE | Intercept | SE | Slope | SE | |
| Cortical bone | ||||||||||||
| 6-24 μm | 5.554e-1 | 3.270e-2 | 6.090e-5 | 5.887e-5 | 5.829e-1 | 2.565e-2 | −8.880e-4 | 3.781e-5 | 2.747e-2 | 4.003e-2 | −9.489e-4 | 6.944e-5 |
| 24-42 μm | 9.893e-1 | 1.308e-1 | −1.366e-4 | 3.871e-5 | 9.910e-1 | 1.051e-2 | −6.294e-4 | 2.639e-5 | 1.635e-3 | 1.599e-2 | −4.928e-4 | 4.566e-5 |
| 42-60 μm | 9.853e-1 | 1.156e-2 | −1.560e-4 | 3.933e-5 | 9.907e-1 | 9.139e-3 | −5.264e-4 | 2.661e-5 | 5.325e-3 | 1.413e-2 | −3.704e-4 | 4.640e-5 |
| Noncortical bone | ||||||||||||
| 6-24 μm | 5.253e-1 | 2.197e-2 | −3.201e-3 | 6.792e-5 | 4.015e-1 | 4.220e-3 | −1.566e-3 | 7.295e-5 | −1.258e-1 | 7.607e-3 | 1.635e-3 | 8.474e-5 |
| 24-42 μm | 9.376e-1 | 2.504e-2 | −3.944e-3 | 7.820e-5 | 8.554e-1 | 4.607e-3 | −2.079e-3 | 7.964e-5 | −6.201e-2 | 8.756e-3 | 1.863e-3 | 9.757e-5 |
| 42-60 μm | 9.399e-1 | 2.590e-2 | −4.048e-3 | 8.077e-5 | 8.629e-1 | 4.822e-3 | −2.082e-3 | 8.336e-5 | −6.501e-2 | 9.045e-3 | 1.965e-3 | 1.008e-4 |
∗ Intercept (at 0% relative region thickness) + (slope · % relative region thickness).
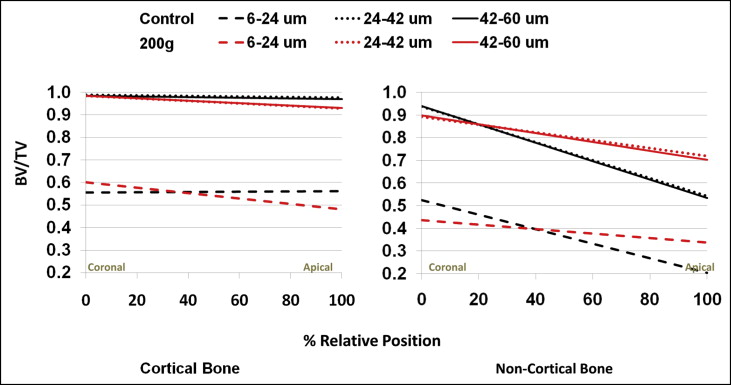
There were no significant ( P <0.05) differences in bone volume fractions between the 24 to 42-μm and the 42 to 60-μm layers of bone. By contrast, the 6 to 24-μm layer showed significantly ( P <0.05) less bone than did the 24 to 42-μm and the 42 to 60-μm layers ( Fig 6 ).
In the coronal aspect of the cortical region, there was no statistically significant ( P <0.05) difference in bone volume fractions between the unloaded control and loaded miniscrew implants ( Tables I and II ). The loaded miniscrew implants showed significantly ( P <0.05) greater decreases in bone volume fractions between the coronal and apical aspects. As a result, the loaded miniscrew implants had significantly less bone apically than did the the unloaded control miniscrew implants ( Figs 5 and 7 ).
There was significantly more control bone surrounding the coronal aspects of miniscrew implants in the noncortical regions ( Tables I and II ). In contrast to the cortical regions, the loaded miniscrew implants demonstrated significantly ( P <0.05) smaller decreases in bone volume fraction between the coronal and apical aspects than did the control miniscrew implants. As a result, there was significantly ( P <0.05) less bone surrounding the apical aspects of the unloaded control miniscrew implants than the loaded miniscrew implants ( Fig 8 ).


