Introduction
The aims of this study were to evaluate the effect of 2 distinct magnitudes of applied force with and without corticision (flapless corticotomy) on the rate of tooth movement and to examine the alveolar response in a rat model.
Methods
A total of 44 male rats (6 weeks old) were equally divided into 4 experimental groups based on force level and surgical intervention: light force, light force with corticision, heavy force, and heavy force with corticision. The forces were delivered from the maxillary left first molar to the maxillary incisors using prefabricated 10-g (light force) or 100-g (heavy force) nickel-titanium springs. The corticision procedure was performed at appliance placement and repeated 1 week later on the mesiopalatal aspect of the maxillary left first molars, with the right sides serving as the untreated controls. Microcomputed tomography was used to evaluate tooth movement between the maxillary first and second molars, and the alveolar response in the region of the maxillary first molar on day 14. Osteoclasts and odontoclasts were quantified, and the expression of receptor activator of nuclear factor kappa ß ligand was examined.
Results
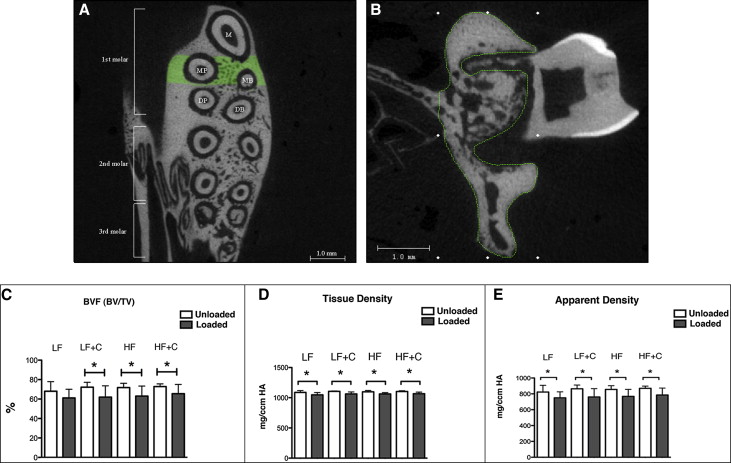
Intragroup comparisons of bone volume fraction (BVF) and tissue density were found to be significantly less on the loaded sides, with the exception of BVF in the light force group. Intergroup comparisons evaluating magnitude of tooth movement, BVF, apparent density, and tissue density showed no significant differences. Histomorphometric analysis indicated that BVF was decreased in the light force group. No significant differences in the total numbers of osteoclasts and odontoclasts and the expression of receptor activator of nuclear factor kappa ß ligand were found between the groups.
Conclusions
No differences in tooth movement or alveolar response were observed with microcomputed tomography based on force level or corticision procedure. A flapless surgical insult in the mesiopalatal aspect of the first molar with a single-site corticision was unable to induce clinical or histologic changes after 2 weeks of orthodontic tooth movement regardless of the force magnitude. Histologic analysis of the furcation area showed that light force significantly decreased BVF.
Although there are numerous benefits of orthodontic treatment, its prolonged duration is often seen as a drawback. The length of therapy is influenced by a number of factors, including the complexity of the malocclusion, the orthodontist’s skill, the patient’s cooperation, and the rate of tooth movement. Extended treatment times have been associated with negative outcomes, such as increased risk for caries, periodontal disease, root resorption, and pulpal reactions. Reducing the duration of orthodontic treatment has the benefit of possibly minimizing these unwanted side effects and improving patient satisfaction and acceptance.
Orthodontic tooth movement is a dynamic process of bone modeling involving anabolic and catabolic responses to mechanical loading. The strains generated by orthodontic forces are transmitted to the periodontal ligament (PDL) and supporting alveolar bone, producing areas of tension and pressure within the PDL, with bone resorption occurring at sites of compression, and bone formation occurring in regions of tension. The velocity of tooth movement is regulated by bone turnover, bone density, and the degree of hyalinization of the PDL in response to the forces being applied. Continuous light forces are widely believed to be the most effective means of producing efficient tooth movement. Ideally, a method to increase tooth movement should be directed by frontal resorption (tightly coupled osteoclast-driven resorption on the compression side) and also cause minimal patient discomfort.
Efforts to enhance the rate of orthodontic tooth movement have targeted these factors and can be categorized as either pharmacological or physical. Pharmacologic agents have been shown to influence orthodontic tooth movement by altering bone metabolism. Despite augmenting tooth movement, these treatments have had limited clinical use because of many negative local and systemic side effects such as hyperalgesia, bone loss and osteoporosis, delayed wound healing, and root resorption. As a result, research has shifted toward physical methods aimed at enhancing tooth movement.
A number of physical methods to increase tooth movement have been examined previously. These have included the use of pulsed and static magnetic fields, electrical currents, lasers, and surgical manipulation of the alveolar bone. Surgical methods to enhance the rate of tooth movement have garnered considerable attention in recent years and include alveolar surgery to undermine interseptal bone, corticotomies, dentoalveolar distraction, dental distraction, and corticision. By enhancing the local catabolic and anabolic processes of bone turnover, these surgical methods might have the potential to increase the rate of orthodontic tooth movement and reduce treatment times.
The clinical applications of these surgical interventions have been hampered by a number of factors, including duration of the effect and poor patient acceptance because of the invasiveness of these procedures. Kim et al introduced the corticision procedure in an effort to develop a minimally invasive approach to induce a regional acceleratory phenomenon effect without flap reflection that could be repeated with less patient discomfort. Unlike corticotomies, in which the surgical insult is obtained by reflecting a full flap to gain access to the cortical bone, with corticision, a reinforced scalpel is used as a thin chisel to separate the interproximal cortices transmucosally without reflecting a flap. These authors demonstrated that even minimally invasive insults to the alveolus with corticision can invoke a regional acceleratory phenomenon effect and stimulate orthodontic tooth movement. More evidence is needed that examines the biologic process involved to fully understand the mechanism by which orthodontic tooth movement can be modulated by these procedures. In addition, determining the effects of light and heavy forces on the overall rate of tooth movement is needed to better understand the optimal range required. The ideal force level for efficient tooth movement also requires further study. This study was designed to assess the rate of tooth movement and the biologic effects of corticision with 2 distinct force magnitudes on the remodeling of alveolar bone 14 days after the initiation of orthodontic tooth movement in a rat model.
Material and methods
A total of 44 male Wistar rats (weight, 150-250 g; Charles River Laboratories, Wilmington, Mass) were used in this study after approval by the Animal Care Committee of the University of Connecticut (number 2010-668). The final sample size was determined by a power analysis performed with data from a pilot study. Based on the initial pilot data, it was determined that 11 rats would be required in each group to provide statistical power (1-ß) of 0.8 and type I error of 0.05. The rats were randomly allocated to 1 of the 4 groups (11 per group) based on the surgical procedure and the application of light (10 g) or heavy (100 g) force: (1) no corticision and 10 g of force (LF), (2) no corticision and 100 g of force (HF), (3) corticision at appliance insertion and 1 week later with 10 g of force (LF+C), and (4) corticision at appliance insertion and 1 week later with 100 g of force (HF+C). The contralateral (right) side was used as the unloaded control for each animal.
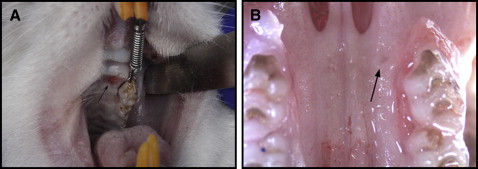
The rats were subjected to orthodontic forces from the maxillary left first molar to the central incisors ( Fig 1 , A ). Closed-coil nickel-titanium springs delivering 10 or 100 g of force were used for the application of the light and heavy orthodontic forces, respectively. The force/deflection rate for the spring was determined to calibrate the amount of force produced by activation of the spring.
The animals were placed under general anesthesia with xylazine (13 mg/kg) and ketamine (87 mg/kg). Only the left side of the maxilla was treated. The contralateral (untreated) side served as the unloaded control for histologic and microcomputed tomography purposes, and to evaluate the physiologic distal drift of the molars. All animals were bonded by 1 investigator (C.A.M.) to eliminate interinvestigator bias. A 0.008-in stainless steel ligature was threaded through the contact between the maxillary left first and second molars. A light or heavy spring was then attached to the 0.008-in stainless steel ligature around the first molar and securely ligated at the mesial surface of the maxillary first molar. Self-etching primer (Transbond Plus; 3M Unitek, Monrovia, Calif) was applied to the mesiopalatal surface of the maxillary first molar, and the ligature was bonded with light-cured dental adhesive resin cement (Transbond; 3M Unitek) using a commercial unit (LEDemetron 1; Kerr, Orange, Calif). To prevent the ligatures from dislodging because of the lingual curvature and eruption pattern of the maxillary incisors, grooves were prepared 0.5 mm from the gingival margin on the distal surfaces of the maxillary central incisors. A second 0.008-in stainless steel ligature was then placed around both maxillary incisors, and the spring was activated and attached to this ligature. After the ligature had been tied and cut, composite resin (Transbond XT Light Cure Adhesive Paste; 3M Unitek) was placed over the wire to prevent slipping and gingival irritation, as well as pulpal irritation to the exposed dentin. Finally, the mandibular incisors were reduced to prevent appliance breakage as described previously. The appliance was checked twice weekly to evaluate its integrity. One week after the initial placement of the appliance, the animals were reanesthetized and the springs reactivated.
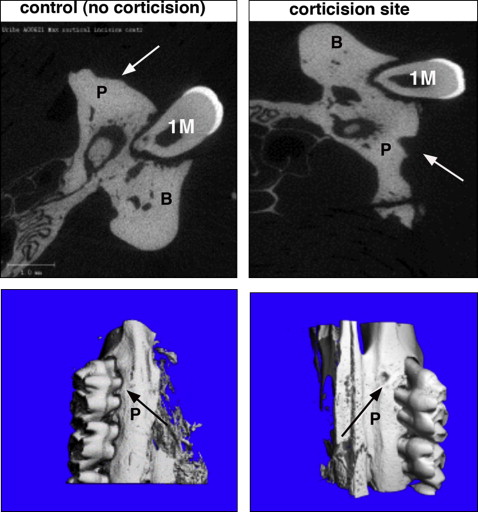
Corticision was applied at the time of orthodontic appliance placement and 1 week later in the corticision groups while the animals were under anesthesia. This protocol was selected based on the results of a previous study in which an orthodontic force with 2 corticision procedures resulted in significantly more tooth movement than with a single or no corticision procedure. Corticision was performed on the mesiopalatal aspect of the maxillary left first molar ( Fig 1 , A ). This location was selected to ensure clear access to the bone adjacent to the first molar, with enough safety margin to prevent injury to the roots of the teeth. The tip of a reinforced surgical blade (number 11; Bard-Parker, Franklin Lakes, NJ) capable of making a surgical incision with a minimum thickness of 400 μm was used. The blade was positioned on the mesiopalatal gingiva, 0.5 mm from the corresponding tooth surface at an inclination of 45° to 60° to the long axis of the maxillary first molar. The blade was inserted gradually through the overlying gingiva into the cortical bone ( Figs 1 , B , and 2 ). The corticisions were performed by 1 investigator (C.A.M.) after being calibrated with deceased rats. This investigator used tactile sense to confirm penetration of the palatal gingiva and bone.
Microcomputed tomography analysis was performed after the experimental period (day 14) for all animals. Each rat was killed, and the maxilla was excised, cleansed of soft tissue, and hemisected. Analysis was performed by the microcomputed tomography facility at the University of Connecticut. Scanning was done at 55 kV and 145 mA, collecting 1000 projections per rotation with a 300-ms integration time. Three-dimensional images were constructed using standard convolution and back projection algorithms with Shepp and Logan filtering and rendered in a 12.3-mm field of view at a discrete density of 578,704 voxels per cubic millimeter (isometric 12-mm voxels).
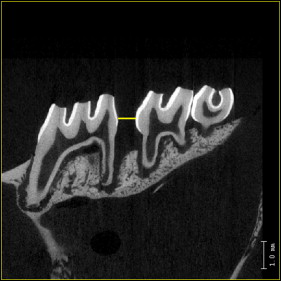
Microcomputed tomography images were used for quantitative analysis of bone changes in the region of the maxillary first molar. Tooth movement and alveolar bone parameters were evaluated. The amount of tooth movement was assessed on 2-dimensional sagittal sections taken through the centers of the maxillary first and second molars (the image plane that showed the most structure of the distobuccal and mesial root) and measured at the interproximal heights of contour between these teeth (the distance between the most mesial point of the second molar crown and the most distal point of the first molar crown, first and second molar distance) ( Fig 3 ). The initial separation distance at day 1 was 0 mm in all groups (ie, convex crown surfaces were touching).
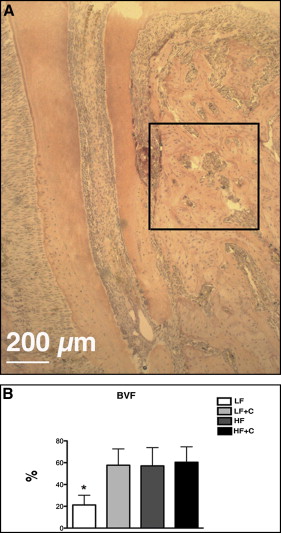
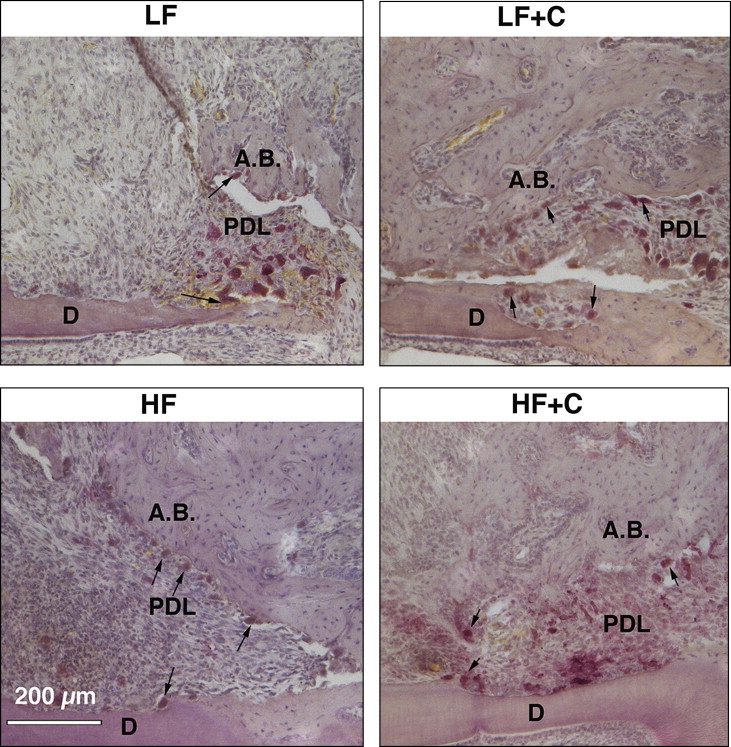
Changes in the alveolar bone were studied by analyzing the furcation area of the maxillary first molar. The region of interest for the alveolar bone analysis was defined vertically as the most occlusal point of the furcation to the apex of the maxillary roots; transversely, it was defined as the space between the buccal and lingual cortical bone; sagittally, it included 40 sections (12 μm) beginning at the mesial root and continuing distally ( Fig 4 , A and B ). Parameters studied included bone volume fraction (BVF), apparent density, and tissue density. BVF, which represents the amount of alveolar bone in the region of interest, was calculated as the percentage of bone volume (BV) to total volume (TV), denoted as BV/TV. Apparent density was a calibrated measure of hydroxyapatite equivalent to the total volumetric mineral density of the trabecular bone (including the bone marrow) normalized to the region of interest (TV). With tissue density, the hydroxyapatite was calibrated to only represent the volumetric mineral density of trabecular bone tissue (BV) and excluding marrow and porosities, thereby closely approximating the amount of mineralized bone.
To quantify the osteoclast activity and relate it to the bone density changes, histomorphometric analysis was performed using 6 animals from each experimental group. Each hemisected maxilla was placed in 10% formalin for 5 days at 4°C with constant agitation. After fixation, the samples were decalcified in 14% EDTA for 4 weeks and processed for standard paraffin embedding. Serial 5-μm sagittal sections of the hemimaxillae were obtained and stained with routine hematoxylin and eosin stains and tartrate-resistant acid phosphatase (TRAP) activity using an acid phosphatase leukocyte kit (Sigma Chemical, St Louis, Mo) according to the manufacturer’s instructions. Three sections showing the most pulp structure of the distobuccal root (midroot sections) were used for the analysis ( Fig 5 , A ). Active osteoclasts were identified as TRAP-positive, multinucleated cells (>2 nuclei) that were touching the bone surface. The exact area for osteoclast quantification included a rectangular box (450 × 450 μm) that was placed on compression side of the alveolar bone with the highest osteoclast activity ( Fig 6 , C ).
BVF was defined as the percentage of BV to TV. To quantify the level of osteoclastic activity, the osteoclast number was then standardized to the BVF. The osteoclast surface was defined as the total surface of active osteoclasts divided by total bone surface in a defined box and indicated as a percentage.
Odontoclasts were identified as TRAP-positive multinucleated cells (>2 nuclei) on the dentin surface and were quantified on the mesial surface of the distobuccal root in the line starting from the bifurcation to the end of the apex of the distobuccal root ( Fig 5 , C ). The odontoclast surface was calculated as the total surface of all odontoclasts divided by the total dentin surface in the defined area.
Mean values for these parameters were calculated from 3 adjacent sections (midroot) for each experimental animal; these were then used for statistical tests.
Histomorphometric analyses were carried out using Osteomeasure software (Osteometrics, Decatur, Ga).
Immunohistologic analyses for receptor activator of nuclear factor kappa β ligand (RANKL) were performed on all experimental groups. RANKL is an osteoblast and osteocyte-derived factor that is essential for the differentiation, activation, and survival of osteoclasts and used as an indicator of osteoclastic activity. Tissue sections were deparaffinized with xylene and rehydrated with decreasing concentrations of ethanol. After rehydration in deionized water, the tissues were incubated in 1X citrate buffer (pH 6.0) at 60°C overnight to unmask the specific antigen. The next day, the tissues were washed in phosphate-buffered saline (PBS) and blocked with 10% normal goat serum in 1% bovine serum albumin for 2 hours. Incubation with the primary antibody was performed at 4°C overnight using rabbit polyclonal anti-RANKL antibody at a concentration of 1:200 in 1% bovine serum albumin (LS-B1425/46594; LifeSpan BioSciences, Seattle, Wash). The next day, the tissues were washed in PBS and incubated with Alexa Fluor 594 goat antirabbit secondary antibody (A11037; LifeTechnologies, Carlsbad, Calif) in 2% normal goat serum and 1% bovine serum albumin at a concentration of 1:200 for 60 minutes. The sections were counterstained with 4′,6-diamidino-2-phenylindole (DAPI) to obtain a total cell number and mounted with 50% glycerol in PBS. The signal was visualized and photographed by fluorescence microscopy using fluorescein isothiocyanate (FITC) and DAPI filter cubes of the Axiovert 200 microscope (Carol Zeiss Microscopy, Jena, Germany). For quantification, 3 sagittal molar sections from 6 different experimental animals were analyzed. Ten-times magnified images of the compression area (mesial surface of distobuccal root) of alveolar bone were used to evaluate the area that included RANKL labeling. RANKL labeling (TRITC-red) was quantified using ImageJ software (National Institutes of Health, Bethesda, Md) and calculated as a percentage per total area in each magnified image. The values from 3 sections were then averaged for each rat, and the means from 6 animals in each experimental group were used to conduct statistical tests.
Statistical analysis
Statistical analyses were performed using GraphPad Prism (GraphPad Software, La Jolla, Calif) with analysis of means and standard deviations for each study parameter. Intergroup comparisons for tooth movement, bone volume parameters by microcomputed tomography and histomorphometry, and RANKL expression were performed with 1-way analysis of variance (ANOVA). Considering multiple pairwise comparisons used across the 4 groups, Bonferroni post-hoc tests were performed to minimize the risk of type I errors. Intragroup comparisons of microcomputed tomography measures of bone density changes comparing the treated with the untreated control sides were performed by paired sample t tests. Significance was accorded at P <0.05. A total of 11 rats were used in each study group, and all were examined for tooth movement and bone volume assessments.
Stay updated, free dental videos. Join our Telegram channel
VIDEdental - Online dental courses


