Introduction
Cone-beam computed tomography (CBCT) has become a routine imaging modality for many orthodontic clinics. However, questions remain about the amount of radiation patients are exposed to during the scans. This study determined the amounts of radiation potentially absorbed by a patient during orthodontic imaging with a CBCT machine with various scan settings compared with a conventional 2-dimensional digital x-ray machine.
Methods
The radiation exposures delivered by a next generation i-CAT CBCT machine (Imaging Sciences International, Hatfield, Pa) at various scan settings and orthopantomograph OP100/OC100 digital x-ray machine (Instrumentarium Dental, Tuusula, Finland) during panoramic and cephalometric radiography were recorded using thermoluminescent dosimeters placed inside a head and neck phantom. The manufacturer-recommended settings for an average adult male were used for both types of machines. Effective doses were calculated using the tissue-weighting factors recommended by the 2007 International Commission on Radiological Protection.
Results
The effective doses at various voxel sizes and field of view settings ranged from 64.7 to 69.2 μSv for standard resolution CBCT scans (scan time 8.9 s) and 127.3 to 131.3 μSv for high resolution full field of view scans (scan time 17.8 s), and measured 134.2 μSv for a high-resolution landscape scan with a voxel size as would be used for SureSmile (OraMetrix, Richardson, Tex) therapy (scan time 26.9 s). The effective doses for digital panoramic and lateral cephalometric radiographs measured 21.5 and 4.5 μSv, respectively.
Conclusions
CBCT, although providing additional diagnostic and therapeutic benefits, also exposes patients to higher levels of radiation than conventional digital radiography.
Three-dimensional (3D) cone-beam computed tomography (CBCT) has rapidly gained prominence in the dental community and is quickly becoming a routine imaging modality for many orthodontic clinics. The technology of CBCT has improved since its introduction into the US market in 2001, allowing more affordable machines to become commercially available. This has resulted in a significant enhancement in the radiologic information gained by clinicians. For instance, CBCT has been reported to allow more accurate diagnosis of skeletal asymmetry, easier location of impacted teeth, improved surgical planning, and increased detection of pathologies.
Along with the ability to capture a patient’s image data in all 3 dimensions comes the advent of new technologies using these data. Several companies have introduced software and techniques designed to allow dental professionals to manipulate the 3D image data, produce convincingly accurate predictions of treatment outcomes, and aid in orthodontic treatment. For instance, SureSmile (OraMetrix, Richardson, Tex), an all-digital system that uses new 3D imaging and computer techniques for orthodontic diagnostics, treatment planning, and fabrication of customized archwires, allows clinicians to manipulate a 3D model of a patient’s teeth and jaws to simulate orthodontic treatment. A robot then transcribes this virtual treatment by producing the custom archwires needed to move the patient’s teeth into the prescribed positions. This technology has been reported to result in better treatment outcomes and significantly shorter treatment times when compared with conventional approaches.
However, questions remain about the amount of radiation patients are exposed to during the diagnostic scans and those needed for advanced treatment techniques. It has been reported that a CBCT scan can expose a patient to 5 to 16 times the amount of radiation of a panoramic radiograph, or 2 to 4 times the levels of a full-mouth radiographic survey. Stochastic effects of radiation, including carcinogenesis and genetic mutations, are a great concern. It is assumed that these effects have no minimum threshold for radiation damage, and the probability of an effect is proportional to the radiation dose. Cells that are actively mitotic are at higher risk of stochastic radiation effects because of possible changes in DNA replication and cell division. This is a special concern to orthodontists because most orthodontic patients are children, who are considered to be especially sensitive to radiation.
The aims of this study were to determine the amount of radiation potentially absorbed by a patient during orthodontic CBCT imaging with various scan settings and to compare it with the amount a patient would receive from a conventional 2-dimensional (2D) digital x-ray machine.
Material and methods
Doses of the following units were investigated: a next generation i-CAT CBCT machine (Imaging Sciences International, Hatfield, Pa) and an orthopantomograph OP100/OC100 digital x-ray machine (Instrumentarium Dental, Tuusula, Finland). Both units were used at various scan settings representing those used for orthodontic imaging ( Table I ).
| Scan protocol | Unit | Filter | FOV (cm) | Voxel size (mm) | Scan time (s) | Tube voltage (kV) | Tube current (mAs) |
|---|---|---|---|---|---|---|---|
| 0.3 voxel portrait CBCT | i-CAT | Standard | 17 | 0.3 | 8.9 | 120 | 18.54 |
| 0.3 voxel HR portrait CBCT | i-CAT | Standard | 17 | 0.3 enhanced | 17.8 | 120 | 37.10 |
| 0.4 voxel portrait CBCT | i-CAT | Standard | 17 | 0.4 | 8.9 | 120 | 18.54 |
| 0.4 voxel HR portrait CBCT | i-CAT | Standard | 17 | 0.4 enhanced | 17.8 | 120 | 37.10 |
| 0.3 voxel landscape CBCT | i-CAT | Standard | 8 | 0.3 | 8.9 | 120 | 18.54 |
| 0.2 voxel landscape CBCT | i-CAT | SureSmile | 8 | 0.2 | 26.9 | 120 | 37.07 |
| Digital panoramic radiograph | OP100 | N/A | 17.6 | 73 | 12.00 | ||
| Digital lateral cephalogram | OC100 | N/A | 16.0 | 85 | 12.00 |
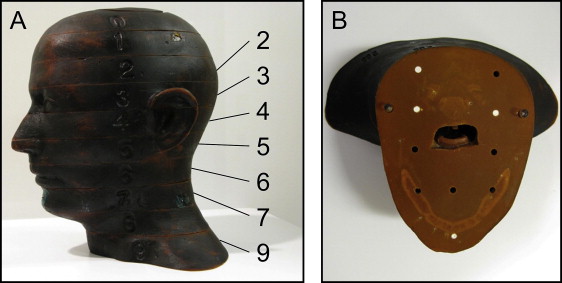
The absorbed radiation dose was recorded with precalibrated thermoluminescent lithium fluoride dosimeter chips (TLD-100, supplied and analyzed by Landauer, Glenwood, Ill). Each set of thermoluminescent dosimeters (TLDs) was accompanied by a transit control to account for potential environmental radiation exposure during shipping. The TLDs were placed at various locations in sections 0 to 9 of a radiation analog dosimetry phantom (RANDO, The Phantom Laboratory, Salem, NY) representing the area from the apex of the cranium to the level of the clavicles of an adult male ( Fig 1 ). RANDO phantoms are constructed with a natural human skeleton cast inside a urethane formula with an effective atomic number and mass density that is radiologically equivalent to soft tissue. The locations of the TLDs ( Table II ) reflected critical tissues known to be the most radiosensitive in the head and neck regions, along with other sites relevant to dental imaging. The TLDs intended to record dosages at surface landmarks were held in place with clear tape. All dosimeters were placed by the same operator (J.K.) to ensure consistency of location and position, and unoccupied drill holes in the phantom were filled with tissue-equivalent rods.
| TLD chip | Location | Phantom section |
|---|---|---|
| 1 | Calvarium anterior | 2 |
| 2 | Calvarium left | 2 |
| 3 | Calvarium posterior | 2 |
| 4 | Midbrain | 2 |
| 5 | Pituitary gland | 3 |
| 6 | Right orbit | 4 |
| 7 | Left orbit | 4 |
| 8 | Right lens of eye ∗ | 3 |
| 9 | Left lens of eye ∗ | 3 |
| 10 | Right cheek ∗ | 5 |
| 11 | Right parotid | 6 |
| 12 | Left parotid | 6 |
| 13 | Right ramus | 6 |
| 14 | Left ramus | 6 |
| 15 | Center cervical spine | 6 |
| 16 | Left back of neck | 7 |
| 17 | Right mandibular body | 7 |
| 18 | Left mandibular body | 7 |
| 19 | Right submandibular gland | 7 |
| 20 | Left submandibular gland | 7 |
| 21 | Center sublingual gland | 7 |
| 22 | Midline thyroid | 9 |
| 23 | Thyroid surface left ∗ | 9 |
| 24 | Esophagus | 9 |
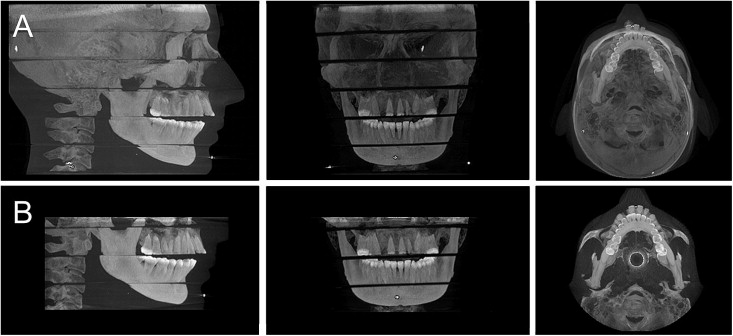
The phantom was positioned in each machine with the midsagittal plane centered in the image field and the occlusal plane parallel to the scan rotation plane. A scout image was taken before the CBCT imaging to ensure that the entire region of interest was within the field of view; Figure 2 demonstrates the irradiated volumes. The scout image was taken without the TLDs in place to ensure that dose calculations did not include radiation exposure during this initial projection image. Moreover, an additional unexposed control dosimeter was kept near the operator during each scan to allow the establishment and subtraction of any absorbed background radiation dose.
The doses for 8 scan protocols for the 2 machines were determined using the manufacturer-recommended tube voltages and tube currents for an average adult male ( Table I ). Three exposures were used for each protocol to provide a more reliable measurement of radiation in the TLDs. Later, the doses were divided by 3 to determine the exposure per scan for each TLD. In order to test the reproducibility of the procedure, the 0.3 voxel portrait CBCT scan was performed on 2 separate occasions. This enabled assessment of the difference in the calculated effective dose caused by variations in setup, such as variations in phantom or TLD positioning.
The equivalent dose was calculated as the product of the background-subtracted mean organ TLD dose and the fraction of that tissue in the irradiated field ( Table III ). The fraction of tissue irradiated was determined using published data on full field-of-view scans. The fraction of bone marrow in the head and neck area was based on the distribution of active bone marrow in an adult body. The bone surface dose was calculated as the product of the bone marrow dose for each TLD site and the bone/muscle mass energy absorption coefficient ratio, where the bone/muscle mass energy absorption coefficient ratio = −0.0618 × 2/3 kV peak + 6.9406.
| Tissue | Fraction irradiated (%) | TLD chips |
|---|---|---|
| Bone marrow | 16.5 | 1-3, 13-15, 17, 18 |
| Thyroid | 100 | 22, 23 |
| Esophagus | 10 | 24 |
| Skin | 5 | 8-10, 16 |
| Bone surface | 16.5 | 1-3, 13-15, 17, 18 |
| Salivary glands | 100 | 11, 12, 19-21 |
| Brain | 100 | 4, 5 |
| Lymph nodes | 5 | 11-15, 17-22, 24 |
| Extrathoracic airway | 100 | 6, 7, 11-15, 17-22, 24 |
| Muscle | 5 | 11-15, 17-22, 24 |
| Oral mucosa | 100 | 11-14, 17-21 |
The effective dose was then calculated as the sum of the tissues’ equivalent dose multiplied by their corresponding tissue-weighting factor according to the 2007 recommendations of the International Commission on Radiological Protection. As performed by Ludlow and Ivanovic, only oral mucosa, lymph nodes, muscle, and the extrathoracic region were included of the tissues making up the remainder category. The other remainder tissues were not directly exposed in the protocols used in this study. Although an assumption of no dose might underestimate actual exposure to these tissues, the impact on total effective dose is negligible.
In order to provide a complete picture of the actual risk to an exposed patient, the effective doses were also calculated as multiples of the dose of a digital panoramic radiograph, one of the most common dental radiographic examinations, and as a percentage of the average annual background dose of 3000 μSv in the United States. Moreover, the probability of fatal cancer in 1 million people was calculated using a risk coefficient of 5.5 × 10 −2 Sv −1 .
Results
A high level of reproducibility was achieved between the 0.3 voxel portrait CBCT scans performed on 2 separate occasions as documented by a variation between effective doses of only 0.66%. However, the 0.3 and 0.4 voxel portrait CBCT scans as well as the 0.3 and 0.4 voxel high-resolution portrait CBCT scans studied use the same fields of view and exposure factors, and thus are good measures of reproducibility, too. Effective doses calculated for these scans varied by 6.72% and 3.09%, respectively.
Equivalent doses calculated for the tissues that were directly exposed during the scans are shown in Table IV . Some of the TLDs used for the dose measurements on the orthopantomograph OP100/OC100 were not exposed at the minimum exposure threshold of 10 mrad (100 μGy), despite being exposed for 3 consecutive scans. In those cases, the maximum possible unrecordable dose of 9 mrad was used in the calculations to prevent underestimation of the effective dose.


