Introduction
Understanding the timing and length of the growth spurt of Class III prognathic patients is fundamental to the strategy of interceptive orthopedic orthodontics as well as to the timing of orthognathic surgery. Consequently, this study was undertaken to determine whether there are any significant differences in the stature growth pattern of Class III subjects compared with non-Class III subjects and the general population.
Methods
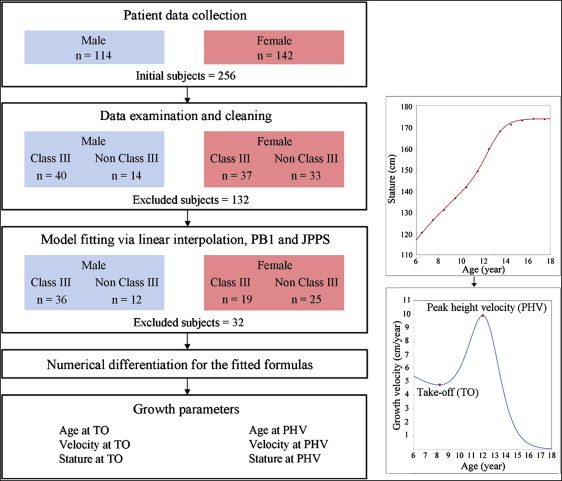
Twelve-year longitudinal stature growth data were collected for 402 randomly selected adolescents in the general population, 55 Class III mandibular prognathic patients, and 37 non-Class III patients. The growth data were analyzed by using the traditional linear interpolation method and nonlinear growth functions. The 6 stature growth parameters were measured: age at takeoff, stature at takeoff, velocity at takeoff, age at peak height velocity, stature at peak height velocity, and velocity at peak height velocity. Comparisons in the stature growth parameters and 15 cephalometric variables among the general population, Class III subjects, and non-Class III subjects were made with multivariate analysis.
Results
Patients with Class III prognathism did not have different growth parameters compared with Class II subjects or the general population.
Conclusions
This study does not allow meaningful conclusions with regard to the relationship of mandibular size and stature growth pattern. The application of nonlinear growth curves vs the traditional linear interpolation method was also discussed.
It is suspected that patients with Class III mandibular prognathism might have a different mandibular growth pattern when compared with the general population or Class I and Class II patients. It is also supposed that Class III patients also have a different growth pattern of stature than the general population. This idea might have started because increase in the size of mandible is enhanced during its pubertal acceleration, and the initiation, duration, and amount of growth vary considerably during the pubertal growth spurt. Some adolescents have a relatively short pubertal growth spurt, whereas others have a longer spurt. If mandibular growth is related to the general growth pattern of stature, then the growth pattern and the velocity of stature growth might be different in Class III mandibular prognathic patients. Since the timing of Class III interceptive orthopedic treatment is often considered to depend on the patient’s growth spurt, better understanding of the relationship of the stature growth spurt and the mandibular growth spurt is fundamental for successfully treating patients with mandibular prognathism.
The orthodontic literature includes many studies regarding an association between peak velocity of mandibular growth and peak velocity of stature growth (peak height velocity) during puberty. In this respect, the concept of skeletal age was introduced to predict the developmental stages of the mandible. Using the concept of skeletal age, we have assumed that the relationship of peak height velocity and mandibular growth peak is close. However, there is controversy with regard to the relationship between skeletal age and facial growth. Since the timing of the development of the hand bones is not necessarily the same as that of the mandible or the stature, skeletal age determined with hand-wrist radiography might not be a reliable predictor of the timing of the peak mandibular growth period. In addition, previous investigators have also found that skeletal age contributes only minimal information regarding potential growth. Eliminating skeletal age as a factor in a growth prediction method did not have much influence on growth evaluation and prediction. Although there is a highly significant correlation between stature growth and hand-wrist skeletal age, it is questionable whether hand-wrist radiographs are helpful in predicting craniofacial growth.
It has been previously reported that Class III subjects have a longer pubertal growth spurt than do subjects with normal skeletal relationships, and that the larger size of the mandible in Class III subjects might be related to the longer duration of their pubertal peak. This could be because Class III patients would have a delayed age at takeoff and peak height velocity, and a prolonged interval between takeoff and peak height velocity. However, contradictory studies reported no differences in the growth patterns between Class III and normal groups. The previously cited reports were based on the cervical vertebral maturational method or the hand-wrist radiography method of Hägg and Taranger and Fishman. If the growth pattern of Class III children is indeed different from that of Class I or Class II patients, this information would be valuable in explaining the growth of the mandible in Class III patients.
To evaluate the growth pattern of a patient, serial growth measurements are required. Stature is known to best reflect skeleton size and has a good association with bone and muscular masses. It is an important indicator of general health and robustness. Therefore, stature has been a measure of general skeletal maturation when discussing the timing of mandibular growth. In this respect, the aim of this study was to determine whether there are any significant differences in the stature growth parameters of Class III subjects compared with non-Class III subjects and the general population. The null hypothesis was that there is no difference for severe Class III subjects from the other subject groups in the growth parameters including age at takeoff and at peak height velocity, and the interval between takeoff and peak height velocity. Differences between growth evaluation and fitting methods, linear vs nonlinear methods, are also discussed.
Material and methods
All random, general population subjects were of Korean ethnicity. To investigate stature growth parameters in the general population, we used the 12-year longitudinal stature growth data of 402 randomly selected adolescents, 236 boys and 166 girls, that we had previously published.
To compare stature growth pattern in the mandibular prognathic patients and the general population, 92 patients from those who sought orthodontic or orthognathic treatment were willing to participate in the study. These patients included 55 with Class III mandibular prognathism and 37 who were non-Class III (Class I and Class II) (48 boys. 44 girls). Class III malocclusion is a common clinical problem among Koreans, occurring in approximately 19% of the general population. All Class III subjects were considered severe enough that orthognathic surgery was the treatment plan of choice. Nonsurgical Class III patients were not eligible to participate ( Fig 1 ).
As part of their orthodontic and orthognathic treatment records, the patient subgroups had cephalometric radiographs taken. To evaluate the size of the mandible, 15 cephalometric variables were included in this study.
- 1.
Total mandibular length, defined as condylion-gnathion (Co-Gn), articulare-gnathion (Ar-Gn), and sella-gnathion (S-Gn).
- 2.
Posterior ramus height, defined as condylion-gonion (Co-Go) and articulare-gonion (Ar-Go).
- 3.
Mandibular body length, defined as gonion-gnathion (Go-Gn).
- 4.
Lower anterior facial height, defined as anterior nasal spine-menton (ANS-Me).
- 5.
Midfacial length, defined as condylion to Point A (Co-A) and articulare to Point A (Ar-A).
- 6.
SNA, SNB, ANB, nasion perpendicular to Point A (Na-A), nasion perpendicular to Point B (Na-B), and chin in relation to nasion perpendicular (Na-Pog).
All subjects were healthy without systemic diseases or developmental anomalies, and none had received treatments that would influence growth.
Twelve-year annual stature growth records were obtained through physical examinations by using scales with a horizontal rod attached to a vertical pillar. A child’s stature is the most preferred variable, since it is easy to measure and record. Because of national policy requirements, stature monitoring for growing children has been a periodic project in Korea; every educational institution has collected at least 12-year serial stature growth data. The physical examinations are made each year from April to June. It was possible to collect longitudinal stature growth data but not the exact dates of all data. By using birth dates, ages at the examinations were calculated by taking the date of the examination as May 1 for each year. The first stature record was taken at age 6 years, and measurements continued to 19 years. Final adult stature was defined when the subject had stopped growth with less than 1 cm of growth during the last year of measurement, as described previously. This definition allowed the final growth timing to be determined for all subjects in our study. Their stature distribution parameters matched favorably with the nationwide cross-sectional population survey, SIZE KOREA 2004 (6360 random subjects: male, 3120; female 3240) and SIZE KOREA 2010 (8011 random subjects: male, 4388; female, 3623).
The institutional review board of Seoul National University School of Dentistry for the protection of human subjects reviewed and approved the research protocol (No. S-D20110004).
During the explorative data analysis, 164 of the 256 initial subjects were excluded ( Fig 1 ), primarily because missing measurements at some time points in the 12-year annual stature growth records. All records were graphically examined by using a monotone Hermite spline according to the method of Fritsch and Carlson. After examining the data with this monotone increasing function, 21 records that showed negative annual increments were eliminated, since a negative increment was most likely due to artifacts.
Fitting the longitudinal growth data into the growth curves was done by using the Levenberg-Marquardt fitting algorithm. This is a method of determining a solution (also called parameter estimates) to a mathematical function. To facilitate finding the solution to a system of equations with numerous variables, this method uses a technique called the “iterative method.” Based on the available data, the iterative method uses an initial guess to find the solution. The solution purported by the initial guess is then analyzed and used to compute the next approximation of the solution until the best solution of the equation is determined. The term “convergence” means that the iterative procedure approached the true solution. Convergence is the notion in probability theory that seemingly random parameters can eventually be explained if the true pattern is determined. Later, at the curve-fitting procedure, another 32 records were excluded because they did not seem to contribute to determining a single growth curve and were considered to be outliers. In these 32 subjects, convergence could not be achieved or yielded a nonunique estimate, meaning that their data were not constructive in developing a single growth curve solution closest to the true solution ( Fig 1 ).
Fitting the growth data into a mathematical formula was performed 3 ways.
Linear interpolation ( Fig 2 ) is the simplest and traditional method with which most previous authors have fitted human growth in stature or in the mandible. In terms of mathematical expression, the linear interpolation steps are as follows. Let us suppose that a stature record at a certain age, a2a2
a 2
, is to be estimated. When there are known statures [ s1s1
s 1
, s3
s 3
] at age [ a1
a 1
, a3
a 3
] respectively, with stature at age a2
a 2
being s2
s 2
, if a2∈[a1,a3]
a 2 ∈ [ a 1 , a 3 ]
, then the stature at age a2
a 2
can be linearly interpolated as s2=(a2−a1)s3+(a3−a2)s1(a3−a1)
s 2 = ( a 2 − a 1 ) s 3 + ( a 3 − a 2 ) s 1 ( a 3 − a 1 )
. Then, estimation of growth velocity at a2
a 2
is such that, from [a1,a3]
[ a 1 , a 3 ]
interval, growth velocity at a1+a32
a 1 + a 3 2
was estimated as s3−s1a3−a1
s 3 − s 1 a 3 − a 1
, and each section can be connected through linear interpolation. For example, in a subject for whom it was impossible to obtain a record at the 11-year time point, the missing value could be estimated by dividing the increments from ages 10 to 12 by 2. However, in this study, patients with missing values were excluded. All records should be available because growth never follows a linear pattern but instead a nonlinear growth curve. In this respect, 111 of 256 patients whose records had a missing measurement were excluded ( Fig 1 ).
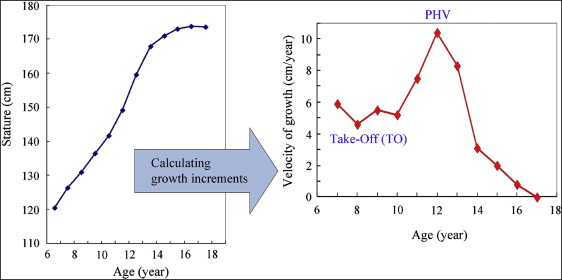
In this study, instead, the linear interpolation method was used only to define the age estimates for growth velocities: the age at the minimum velocity (takeoff) and the age at the peak (maximum) height velocity. Takeoff and peak height velocity age estimates were recorded at the midpoints of the interval for which they were observed, respectively. However, with this interpolated definition of age estimates, it is not uncommon for a subject to have 2 or more takeoff or peak height velocity estimates. According to the methods in previous studies, when 2 equal consecutive increments were the lowest or the largest, the whole-year midpoint of the combined interval was recorded as the takeoff and the peak height velocity, respectively.
Because of the wide individual variations in the timing of the takeoff and the peak height velocity, a number of nonlinear growth functions have been developed to describe stature growth and to better understand growth variations. Human stature has attracted much interest, perhaps in part because of its remarkable regularities, but undoubtedly also because of the pubertal growth spurt. In any of its varied aspects, the nature of growth makes it a suitable candidate for mathematical methods of description and analysis; this is especially true of the individual growth curve. In this study, stature growth data were fitted to 2 types of nonlinear growth curves, model 1 of Preece and Baines and the model of Jolicoeur et al. These 2 formulas have already been practically applied in several study poplications.
The Preece and Baines 1 38 formula consists of 3 unknown parameters and takes the form:
y = f ( x ) = h 1 − 2 ( h 1 − h ) exp [ 1 ( x − 0 ) ] + exp [ 2 ( x − 0 ) ]
Stay updated, free dental videos. Join our Telegram channel
VIDEdental - Online dental courses


