The dental workforce refers to the number, distribution, and characteristics of dentists, dental auxiliaries, and other support staff involved in the provision of oral health care. This article reviews the changes in the dental workforce that have taken place, especially during the last 50 years, the present status of the workforce, and projections about the adequacy and composition of the dental workforce in the coming years.
Dental workforce refers to the number, distribution, and characteristics of dentists, dental auxiliaries, and other support staff involved in the provision of oral health care. During the past half century, the perception of the dental workforce has fluctuated from fears of a shortage to warnings of an oversupply. Consequently, it is pertinent to view the factors that can affect changes in the supply of the dental workforce as well as the attitudes regarding the adequacy of that supply. The dental workforce supply is influenced by a variety of factors; prominent among them are demographics, dental disease rates, economics, and consumer habits. Changes in these factors in turn influence the manner in which dentistry is practiced. Patterns of dental practice can affect the supply and distribution of the dental workforce. Thus, examining these data will enhance the understanding of the changes in the dental workforce and help anticipate future trends.
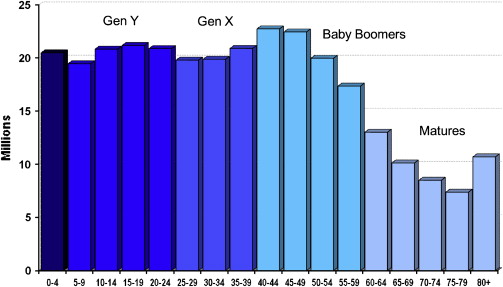
Since 1950, the population of the United States has almost doubled, from 152,271,417 to an estimated 301,621,157 in 2007. Moreover, the population today can be subdivided into a variety of demographic cohorts based on their year of birth. Fig. 1 shows the distribution of population and identifies some of the most common cohorts. Individuals born before the end of World War II (1945) are referred to as the “World War II generation.” There were approximately 68 million of these individuals in the United States in 2005. The Baby Boomers were born between 1946 and 1964, and there were approximately 80 million of them in 2005. Members of Generation X were born between 1965 and 1979. This cohort is smaller, with approximately 50 million individuals. Generation Y sometimes is referred to as the “Baby Boom echo.” They were born between 1980 and 2001, and there are 75 million of them. In 2005, almost 46% of the population of the United States was comprised of the World War II and Baby Boomer generations.
By 2020, as these population cohorts age, their relative contribution to the total population will change. The number of members of the World War II generation will drop to just under 23 million, and the number of Boomers will decrease to about 74.5 million. Together these two cohorts will represent only about 29% of the total population. The size of the various cohorts impacts changes in dental disease.
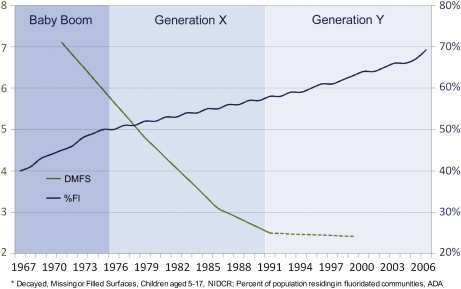
Dental caries is the most prevalent disease of the oral cavity. Since the early 1970s, caries rates generally have declined in children. In 1971, children between the ages of 5 and 17 years had an average of 7.1 decayed, missing, and filled tooth surfaces (DMFS) in their permanent dentition. By 1991, the average of DMFS in children of that age had dropped to 2.5, a 64.8% decrease. Recent data suggest that the decline in DMFS in the permanent teeth of children has continued but at a slower rate. These recent data also show a slight, but not statistically significant, increase in caries in primary teeth.
Increased exposure to fluoride has been widely recognized as a significant cause for this decline in caries. In 1967, only 40% of the population lived in communities that had fluoridated water. By 2006, 69.2% of communities had fluoridated water. Fluoride also is found in most toothpaste and in many mouthwashes. Greater awareness of the need to maintain good oral hygiene through improved home care also contributes to decreasing caries rates. Fig. 2 charts the decline in dental caries, the increased percentage of community fluoridation, and how the decrease in dental caries has affected the generational cohorts. The Baby Boomer generation was at the very beginning of the caries decline. Generation X experienced the largest decline in caries rates, dropping from an average of 5.95 DMFS to 2.62. Generation Y and those generations that follow will reap the benefits of lower caries rates.
Expenditures for dental services increased from just under $2.0 billion in 1960 to $91.5 billion in 2006, an increase of more than 45-fold. The U.S. Centers for Medicare and Medicaid Services (formerly the Health Care Financing Administration) have projected the level of expenditures to the year 2017. These projections show expenditures for dental services increasing annually to $169.6 billion by the end of the projection period—an additional increase of $78.1 billion in total annual expenditures for dental services over the next 11 years. These expenditure data were divided by the total population of the United States to arrive at per capita expenditures for dental services. Per capita expenditures for dental services increased from $10.86 in 1960 to $305.20 in 2006, an increase of more than 28-fold or an average annual increase of 7.4% per year. Per capita expenditures are projected to increase to $517.50 by 2017, or an average annual increase of 4.9% per year. The total expenditures for dental services divided by the number of active dentists provides a rough estimate of the gross income per dentist. Expenditures per dentist increased from $21,787 in 1960 to $586,781 in 2007, an increase of more than 26-fold or an average annual increase of 7.3%. If the projections hold true, expenditures per dentist should rise to $1,150,583 by 2017, an average annual increase of 6.3%.
The mix of payment methods for dental services also has undergone major shifts. In 1960, out-of-pocket expenditures accounted for more 97% of dental payments. Insurance as a source of dental payments increased rapidly through the decades of the 1970s, 1980s, and early 1990s, peaking at 52.3% of dental expenditures in 1996. Since then, insurance as a source of payment has decreased slowly to 49.6% in 2006. Government sources of dental payments were virtually nonexistent in 1960, accounting for less than 1% of all expenditures. Government funding has risen slowly since then to 6.0% in 2006. Consequently, the profile of expenditures for dental services in 2006 was 49.6% from insurance, 44.4% from out-of-pocket payments by patients, and 6.0% from government sources. In contrast, government sources accounted for 34.2% of expenditures for physician and clinical services in 2006. The U.S. Centers for Medicare and Medicaid Services predicts insurance, as a source of expenditures for dental services, will decline only slightly, to 49.5%, in 2017. They also estimate out-of pocket expenditures will decline slightly, to 43.5% of expenditures, and that government sources will increase to 7.0% of all dental expenditures by 2017. This projection estimates that government expenditures for dental services will double by 2017 to approximately $11.8 billion. Historically, government expenditures for dental services have not increased at this rate.
Long-term economic trends are heavily influenced by changes in the inflation rate. By adjusting actual data (real dollars) using the Bureau of Labor Statistic’s Consumer Price Index (CPI), one can compensate for inflationary effects and view these economic trends in constant dollars. Therefore, the income and expenditure data presented here are adjusted by the CPI to reflect constant dollars. In this way, one can better ascertain real rather than inflation-induced growth.
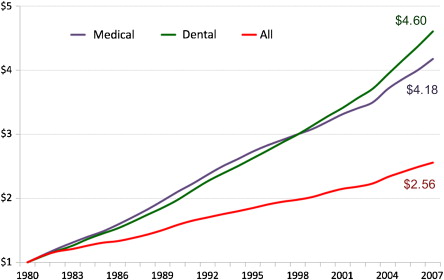
The cost of goods and services is influenced by inflationary factors. Fig. 3 shows how inflation has affected the cost of all goods and services, medical services, and dental services during the past 27 years. This graph shows how much a dollar’s worth of goods and services in 1980 would cost today. For example, the cost of a gallon of gasoline in 1980 was about $1. The cost of $1 worth of all goods and services has risen to $2.56, an increase in inflation of approximately 156% during the past 27 years. The cost of medical services has risen more quickly. Medical services that cost $1 in 1980 would cost about $4.18 today. The cost of dental services has risen even more. That dollar’s worth of dental services in 1980 now would cost $4.60. There are several reasons for the increased cost of dental services, including increased requirements for infection control protocols and increasing staffing levels. The issue of staffing level is discussed in more detail later in this article.
Dental incomes generally follow the trend in dental expenditures. In 1952, the average total net income for all dentists was $10,539. By 2005, the average net income had increased to $214,941, an increase of more than 20-fold. As in the expenditure data, these income figures are influenced by inflationary trends. To see whether dentists’ incomes really have improved, the income data were adjusted by the CPI. Real dental incomes (in 1950 dollars) have not always increased. Between 1972 and 1983, the average real income per dentist fell by 26.3%, but it increased by 21.8% in the next decade (1982–1991), and from 1992 to 2005 the real average income increased by 41.1%.
As these data suggest, periods of high inflation have a negative impact on dental incomes. Real dental incomes fell between 1973 and 1983 as the CPI increased by a whopping 124% (an average inflation rate of 8.2% per year). As incomes rose steeply from 1992 to 2005, the average annual increase in inflation was only 2.6%. During periods of double-digit inflation, dentists generally are not able to increase their fees to keep pace with inflationary pressures; consequently, real incomes tend to fall during these times.
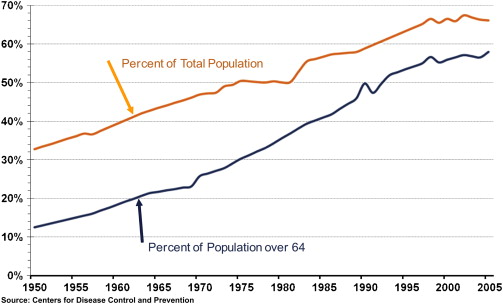
An important economic measure is the percentage of the population who visit the dentist on a regular basis. During the past half-century, Americans have established a tradition of visiting the dentist on a regular basis. In 1950, less than one third of the total population and less than 15% of the population aged over 64 years had at least one dental visit during that year ( Fig. 4 ). By 1998, almost two thirds of the total population (66.2%) and more than 56% of the population aged over 64 years had an annual dental visit. Since 1998, however, these percentages have been rather flat. In 2005, 65.8% of the total population and 57.7% of the population over 64 years of age had a dental visit. A greater awareness of the benefits of regular, monitored oral health care probably is responsible for the increase in annual patient visits in the overall population, and decreasing levels of edentulism is the likely principal cause for the higher visitation rates among older population groups.
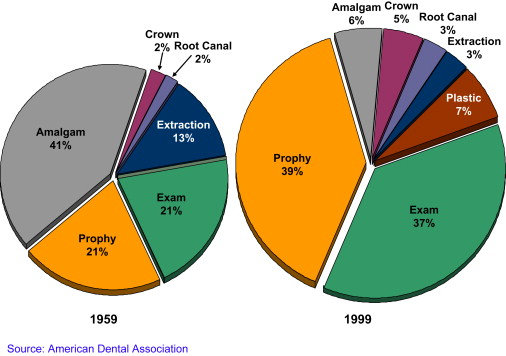
The mix of services provided in the dental office also has changed appreciably during the past 40 years ( Fig. 5 ). In 1958, 42% of all services in the dental office were examinations and prophylaxis. Amalgams accounted for an additional 41% of all services. Extractions made up an additional 13% of services. Thus the typical visit to the dentist in the 1950s comprised an examination, a cleaning, amalgams, and the occasional extraction. By 1999, this profile of services for the general practitioner had changed considerably. In 1999 Examinations and prophylaxis represented 76% of all dental services in the office. Restorations comprised 13% of the procedures, and there were more plastic restorations than amalgams. The remaining 11% of procedures comprised prosthodontic, endodontic, periodontal, and other specialty-type procedures. Only 3% of all procedures were extractions. Data from the American Dental Association’s (ADA) electronic claims database suggest these trends are continuing. In 1983, 86% of the claims were from either diagnostic or preventative procedures, and restorative procedures accounted for only 6% of the claims. Obviously, the distribution of fees for these procedures was quite different. Nevertheless, the diagnostic and preventative procedures accounted for more than half the fees (54%), and the restorative procedures accounted for 22% of the fees.
The shift in the types of services provided has prompted a change in the mix of personnel involved in the provision of these dental services. Since 1955, there has been a significant increase in the auxiliary personnel involved in the dental office, with the exception of dental laboratory technicians, which has not changed appreciably. The percentage of dentists who employ at least one dental assistant has increased from about 70% in 1955 to nearly 100% of all dentists today. The most dramatic change, however, has been in the employment of dental hygienists. In 1955, only about 10% of dentists employed a dental hygienist. In 2000, about 74% of general dentists employed a dental hygienist. This increase in the use of dental hygienists follows the shift toward more preventive services, a higher percentage of the population receiving routine dental care, and a general decline in the caries rate.
The increased use of dental auxiliaries strongly indicates that the number of dental office personnel has expanded, and that is certainly the case. The average size of a dental office staff has increased by about 450% during the past half century. The average number of staff members in the dental office in 1950 was less than one—a significant number of dentists still worked alone. Today’s dental office is far more complex, with multiple assistants, dental hygienists, and front desk personnel. There was an average of 4.5 staff members in the dental office in 2000, and the trend for increasing staff size is likely to increase.
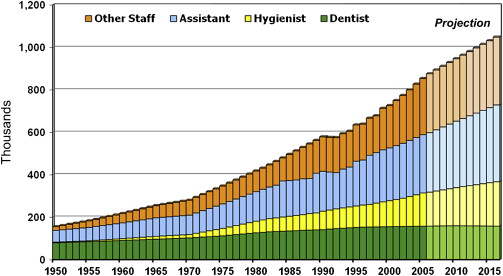
Another way of looking at this trend is to view the total number of dental personnel in the labor force ( Fig. 6 ). In 1950, there were approximately 155,000 dental office personnel, including dentists, dental hygienists, dental assistants, and other staff; slightly more than 50% of these individuals were dentists. By 2006, the number of dental office personnel had risen by more than fivefold, to more than 875,000, but less than 20% of these individuals were dentists. The Bureau of Labor Statistics predicts a continuing increase in the employment of dental hygienists, assistants, and other dental office personnel. By 2016, the number of dental hygienists is predicted to increase from 160,122 in 2006 to 209,019 (30.5%); the number of dental assistants is predicted to increase from 280,000 in 2006 to 362,000 (29.3%); and other dental office personnel are predicted to increase from 277,441 in 2006 to 319,401 (15.1%). Based on these projections, more than 1 million persons will be employed in dental offices in 2014, and dentists will represent about 15% of these personnel.
These changes have a profound impact on the dental workforce levels, the state of the profession, and people’s attitudes toward the profession of dentistry. For young adults, it may influence their perception of the viability of dentistry as a potential career. This perception, along with the perception of the viability of competing careers, has a profound influence on the size and character of the applicant pool for dental schools.
Enrollment
During the past half-century, dramatic changes have occurred in the number of applicants to dental school, demonstrating these changing attitudes. Wide swings in the number of applicants can influence dental schools to increase or decrease enrollment, open new schools, or close existing schools. Between 1963 and 1975, the number of applicants to dental schools increased by almost 10,000 from 5770 to 15,734. In the late 1970s and throughout the 1980s there was a growing perception that there were too many dentists and that the decreases in dental caries levels would dramatically reduce the need for dentists in the future. As a result, the number of applicants decreased as rapidly as it had risen, falling to 4996 in 1989. Since then, the number of applicants to dental school has increased again, to 10,731 in 2005—the largest applicant pool since 1978. The percentage of women applicants generally has increased as well. Between 2002 and 2005, the percentage of women applicants hovered around 44%.
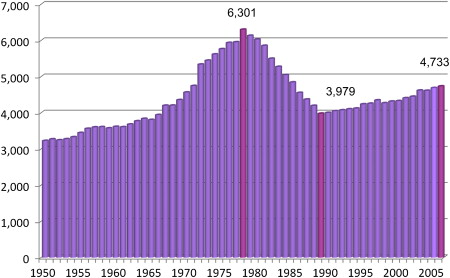
Since 1950, first-year dental school enrollments have gone through four distinctly different periods ( Fig. 7 ). Between 1950 and 1965, first-year enrollment increased slowly from 3226 to 3808 (18.0%), an increase of about 1.2% per year. During this period, new dental schools were being established, increasing from 42 to 49 (16.7%) by 1965, in part, because of an influx of federal support. The period between 1965 and 1978, when the Baby Boomer generation went to dental school, is marked by rapid growth in first-year enrollment, increasing from 3808 to 6301 (65.6%); an average annual increase of 5.0%. New dental schools continued to open, reaching a total of 60 in 1978. Between 1978 and 1989, the rapid rise in enrollment in the previous decade was matched by an equally dramatic decline. By 1989, first-year enrollment had fallen to 3979, a decrease of 2322 students (36.9%). The decline was fueled by a precipitous drop in the number of applicants to dental school and the withdrawal of federal support for enrollment expansion. By 1989, five dental schools had closed or were in the process of closing. First-year enrollment has increased slowly since 1989, rising to 4770 in 2007 (an increase of 791 students), an average annual increase of 1.0% per year. In comparison during this period, the United States population increased by 1.2% per year. During this time, one additional dental school closed, and five new schools opened.