Introduction
Our objectives were to assess the depth of the curve of Spee (COS) in different malocclusion groups, to relate this to the eruption of anterior or posterior teeth quantitatively, and to determine whether the depth of the COS is affected by the vertical eruption of anterior or posterior teeth.
Methods
Two hundred conventional lateral cephalograms and 3-dimensional models of untreated patients (70 boys, mean age: 16.4 ± 1.4 years; 130 young women, mean age: 18.1 ± 1.8 years) were included and assigned to 4 malocclusion groups as Class I, Class II Division 1, Class II Division 2, and Class III. The depth of the COS, overjet, and overbite were measured on 3-dimensional models. The perpendicular distance between the incisal tip of the mandibular central incisor (L1-MP), the deepest point of the COS (S-MP), and the distobuccal cusp tip of the mandibular second molar (L7-MP) to the mandibular plane were calculated and proportioned with each other. The Pearson correlation coefficient was calculated, and multiple linear regression analysis was carried out. Also, multivariate analysis of variance was performed at the P <0.05 level.
Results
The mesiobuccal cusp of the first molar was the deepest part of the COS in all groups, with a maximum depth of 2.44 ± 0.73 mm in the Class II Division 1 subjects and a minimum depth of 1.76 ± 0.94 in the Class III subjects. The depth of the COS changed as follows: Class II Division 1 > Class II Division 2 > Class I > Class III malocclusion groups. Statistically significant positive correlations were found between the depth of the COS and L1-MP/S-MP (r = 0.541) and L7-MP/S-MP (r = 0.269) in the Class I and Class III subjects, and between the depth of the COS and overjet (r = 0.483) and L7-MP/S-MP (r = 0.289) in the Class II Division 1 subjects. All variables except overjet had positive correlations with the depth of the COS in Class II Division 2 subjects. The multivariate analysis of variance showed statistically significant differences in overjet, overbite, L1-MP/S-MP, L7-MP/S-MP, and the depth of the COS ( P <0.001) among the groups.
Conclusions
Although the overjet differed, vertical eruption of the anterior teeth did not differ among the different malocclusion groups and had a significant contribution to the depth of the COS in subjects with Class I and Class III malocclusions.
Highlights
- •
Eruption of front teeth affected curve of Spee depths in Class I and Class III malocclusions.
- •
Eruption of back teeth affected curve of Spee depths in Class II Division 2 malocclusions.
- •
Curve of Spee depths did not differ between Class II Division 1 and Division 2 malocclusions.
The curve of Spee (COS) is a naturally occurring phenomenon in the human dentition; this curve of occlusion was first described as the line on a cylinder tangent to the anterior border of the condyle, the occlusal surface of the second molar, and the incisal edges of the mandibular incisors.
The developmental and functional significances of the COS have been investigated by several researchers. A combination of factors, including growth of orofacial structures, development of the neuromuscular system, and eruption of teeth, was suggested for development of the COS.
On average, eruption of the mandibular permanent first molars precedes that of the maxillary permanent first molars by 1 to 2 months, and eruption of the mandibular permanent central incisors precedes that of the maxillary permanent central incisors by 12 months. Moreover, the mean age for the eruption of the mandibular second molars is 6 months before the maxillary second molars. This differential timing could permit unopposed mandibular permanent first molar and incisor eruptions beyond the established mandibular occlusal plane. On the other hand, Andrews mentioned a natural tendency for deepening of the COS with aging. With the growth of the mandible beyond that of the maxilla, the mandibular incisors are restricted by the maxillary incisors and forced to move backward and upward, and this causes deepening of the bite and the COS at the same time. Hemley described the COS as mesial tipping of the mandibular molar and distal tipping of the mandibular canine with the 2 premolars locked below the line of occlusion. He indicated that these conditions create an exaggerated COS; by distally uprighting the molar and mesially uprighting the canine, the 2 premolars will be free to erupt into the line of occlusion. Strang and Thompson described a deep COS as a result of elevated anterior teeth, depressed premolars, and mesially inclined molars.
Spee et al recommended that the COS should be taken into account for the construction of dentures to provide better mastication and prevent a lever effect during function. However, orthodontics differs from reconstructive dentistry regarding the clinical significance of the COS. Andrews described the 6 keys of occlusion and found that the COS ranged from flat to mild in subjects with proper occlusion, remarking that the best static intercuspation occurred when the occlusal plane was relatively flat. He also stated that leveling and flattening of the COS should be the goal of treatment. In a previous study, increases in the crush-shear ratio of the posterior teeth and the efficiency of the occlusal forces during mastication were determined to be resulting factors of the biomechanical function of the COS.
It has been reported that an excessive COS is associated with deepbite malocclusions. Burstone stated that the treatment of deepbite might involve intrusion of maxillary anterior teeth, intrusion of mandibular anterior teeth, extrusion of maxillary and mandibular posterior teeth, or any such combination. However, Schudy advocated that a deepbite and a deep COS should be corrected by extrusion of the molars because intrusion of anterior teeth has a high potential for relapse. Since there is no consensus on this issue, developmental characteristics of the COS need to be evaluated in terms of differential vertical eruption on anterior or posterior teeth. Therefore, the purposes of this study were to determine the depth of the COS in different malocclusion types and to investigate the relationship of the depth of the COS with the vertical eruption of anterior and posterior teeth, aiming to contribute to the knowledge about the development of the COS. The null hypotheses tested were the following: (1) there is no difference in the depth of the COS among different malocclusions, (2) vertical eruption of anterior or posterior teeth has no effect on the depth of the COS, and (3) the effects of vertical eruption of anterior or posterior teeth on the depth of the COS do not differ among Class I, Class II Division 1, Class II Division 2, and Class III malocclusions.
Material and methods
This study was designed as a retrospective archive study and was carried out after institutional approval for the inclusion of human material obtained from Izmir Katip Celebi University in Turkey. No ethical approval was sought because of the retrospective characteristics of the study design. As routine procedures, digital models and radiographs including lateral cephalograms are obtained from all patients seeking orthodontic treatment, and the patients or their parents sign an informed consent form before the orthodontic treatment or x-ray exposure. Therefore, the patients were not unnecessarily subjected to additional radiation or any other procedures.
The records of 1378 patients who had orthodontic treatment in the Department of Orthodontics at our university between May 2012 and March 2014 were reviewed. Pretreatment conventional lateral cephalograms and digital models of 200 patients (67 male, mean age: 16.4 ± 1.4 years; 133 female, mean age: 18.1 ± 1.8 years) were selected and divided into 4 equal groups according to dental malocclusion type: Class I (15 male, mean age: 16.4 ± 1.2 years; 35 female, mean age: 18.2 ± 2.4 years), Class II Division 1 (17 male, mean age: 16.6 ± 1.6 years; 33 female, mean age: 18.9 ± 1 years), Class II Division 2 (18 male, mean age: 16.0 ± 1.6 years; 32 female, mean age: 17.8 ± 1.3 years), and Class III (17 male, mean age: 16.6 ± 1.2 years; 33 female, mean age: 17.7 ± 2.7 years) ( Table I ). Subjects with a Class I malocclusion had Class I canine and molar relationships. Subjects in the Class II Division 1 and Class II Division 2 malocclusion groups had bilateral Class II molar relationships in centric occlusion with the distobuccal cusp tip of the maxillary first molar within 1 mm (anterior or posterior) from the buccal groove of the mandibular first molar and Class II permanent canine relationships with 2 or more proclined or retroclined maxillary incisors, respectively. Subjects in the Class III malocclusion group had bilateral Class III molar relationships in centric occlusion with the cusp tip of the maxillary second premolar within the range of 1 mm (anterior or posterior) from the buccal groove of the mandibular first molar and Class III permanent canine relationships with excessive negative overjet. All patients fulfilled the following inclusion criteria: (1) dental crowding or spacing less than 2 mm with well-aligned maxillary and mandibular dental arches, (2) all teeth present except the third molars, (3) no significant medical history, (4) no history of trauma or facial asymmetry, and (5) no previous orthodontic or prosthodontic treatment, or maxillofacial or plastic surgery.
| Male | Female | |||
|---|---|---|---|---|
| n | Age (y) | n | Age (y) | |
| Class I | 15 | 16.4 ± 1.2 | 35 | 18.2 ± 2.4 |
| Class II, Division 1 | 17 | 16.6 ± 1.6 | 33 | 18.9 ± 1 |
| Class II, Division 2 | 18 | 16.0 ± 1.6 | 32 | 17.8 ± 1.3 |
| Class III | 17 | 16.6 ± 1.2 | 33 | 17.7 ± 2.7 |
| Total | 67 | 16.4 ± 1.4 | 133 | 18.1 ± 1.8 |
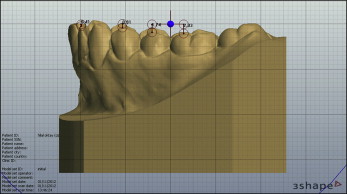
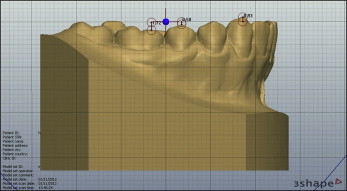
All plaster models were transformed into digital format by a 3-dimensional (3D) model laser scanner (D250 3D dental scanner; 3Shape A/S, Copenhagen, Denmark), and the digital models were analyzed by 1 investigator (M.A.O.) using 3Shape Orthoanalyzer software (version 1.0; 3Shape A/S). The depth of the COS was measured as follows.
A horizontal reference plane comprising a line between the central incisors and the distobuccal cusp tips of the mandibular second molars was constructed using the grids available on the software. The perpendicular distances from the buccal cusp tips of the involved teeth to the constructed line through the horizontal reference plane were evaluated, and the deepest points of the COS were calculated for the right and left sides ( Figs 1 and 2 ). The depth was defined as the average of both sides.
Overjet was measured as the distance (in millimeters) along a horizontal plane between the incisal edge of the labial surface of the mandibular central incisor and the incisal edge of the labial surface of the most labially positioned maxillary central incisor, and overbite was measured as the vertical distance (in millimeters) between the incisal edge of the maxillary central incisor and the incisal edge of the mandibular central incisor using the software.
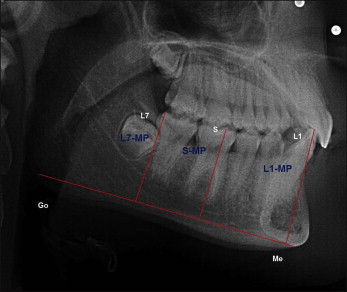
All conventional lateral cephalograms were taken from the right side with the orthopantomography x-ray device (OP100; Instrumentarium, Tuusula, Finland) in maximal intercuspal position. The measurements were made on Dolphin Imaging software (Dolphin Imaging & Management Solutions, Chatsworth, Calif) by 1 examiner (M.A.O.). In case of double images, the 2 relevant points were joined by an intersecting line, and the midpoint was considered as the reference point. The following reference points and planes were used ( Fig 3 ): L1, the incisal tip of the mandibular central incisor; L7, the distobuccal cusp tip of the mandibular permanent second molar; mandibular plane (MP), the line between gonion and gnathion; L1-MP, the perpendicular distance from the tip of L1 to the mandibular plane; L7-MP, the perpendicular distance from the distobuccal cusp tip of L7 to the mandibular plane; and S-MP, the perpendicular distance from the deepest point of the COS to the mandibular plane. Overjet, overbite, L1-MP/S-MP, and L7-MP/S-MP were evaluated for each patient.
The errors of the method were calculated from 20 randomly selected lateral cephalogram and digital models by means of Dahlberg’s formula, and intraexaminer reliability was quantified using the intraclass correlation coefficient.
Statistical analysis
The Kolmogorov-Smirnov test of normality showed that all 5 response variables satisfied the normal distribution assumption for at least 3 of the 4 groups. However, the multivarate analysis of variance (MANOVA) analysis yielded a Box’s test statistic, implying that the observed variance-covariance matrices of the outcome variables were not equal across the groups; this was also verified by the Levene univariate test for homogeneity of group variances, which indicated significant results for the response variables.
The paired sample t test was used for side comparisons, and Pearson correlation coefficients were calculated to determine the linear associations among overjet, overbite, L1-MP/S-MP and L7-MP/S-MP ratios, and depth of the COS. To asses the contribution of individual variables to the depth of COS, linear multiple regression analysis with the enter method was carried out.
A MANOVA test was performed to compare the 4 groups on 5 response variables: overjet, overbite, L1-MP/S-MP ratio, L7-MP/S-MP ratio, and depth of the COS. After obtaining a significant multivariate test, follow-up tests were done: eg, univariate tests and Bonferroni corrected pair-wise comparisons. All statistical analyses were performed using the Statistical Package for the Social Sciences software package (SPSS for Windows, version 20.0; IBM, Armonk, NY), and the nominal alpha level was set at 0.05 for significance.
Results
The errors for the linear measurements varied between 0.4 and 0.6 mm, and a high degree of intraexaminer reliability was noted for all variables (intraclass correlation coefficient, 0.936-0.989).
The means, standard deviations, and minimum and maximum values of the average perpendicular distances for all groups are presented in Table II . The mesiobuccal cusp of the first molar was the deepest part of the COS in all groups, with a maximum depth of 2.44 ± 0.73 mm in Class II Division 1 subjects and a minimum depth of 1.76 ± 0.94 in Class III subjects. The depth of the COS changed as follows: Class II Division 1 > Class II Division 2 > Class I > Class III malocclusion groups.
| Tooth | Group | n | Mean | SD | Minimum | Maximum |
|---|---|---|---|---|---|---|
| L2 | Class I | 50 | 0.086 | 0.338 | −0.715 | 0.910 |
| Class II Division 1 | 50 | 0.223 | 0.396 | −0.695 | 1.785 | |
| Class II Division 2 | 50 | −0.023 | 0.281 | −0.985 | 0.635 | |
| Class III | 50 | 0.049 | 0.237 | −0.835 | 0.820 | |
| L3 | Class I | 50 | 0.248 | 0.695 | −1.230 | 2.005 |
| Class II Division 1 | 50 | 0.577 | 0.986 | −1.550 | 3.760 | |
| Class II Division 2 | 50 | 0.253 | 0.655 | −1.820 | 1.555 | |
| Class III | 50 | 0.162 | 0.708 | −1.735 | 1.820 | |
| L4 | Class I | 50 | 0.955 | 0.678 | −0.960 | 2.705 |
| Class II Division 1 | 50 | 1.846 | 0.862 | 0.530 | 4.610 | |
| Class II Division 2 | 50 | 1.637 | 0.787 | 0.000 | 4.110 | |
| Class III | 50 | 1.050 | 1.021 | −1.715 | 3.065 | |
| L5 | Class I | 50 | 1.561 | 0.667 | 0.565 | 3.130 |
| Class II Division 1 | 50 | 2.311 | 0.766 | 1.125 | 4.710 | |
| Class II Division 2 | 50 | 2.312 | 0.855 | 0.525 | 4.660 | |
| Class III | 50 | 1.507 | 1.044 | −0.450 | 3.645 | |
| L6 | Class I | 50 | 1.942 | 0.679 | 0.940 | 4.065 |
| Class II Division 1 | 50 | 2.459 | 0.738 | 0.870 | 4.705 | |
| Class II Division 2 | 50 | 2.394 | 0.834 | 0.315 | 4.585 | |
| Class III | 50 | 1.767 | 0.949 | −0.070 | 3.945 |
The results of the paired sample t test showed no significant differences in the depth of the COS between the right and left sides for all groups ( Table III ).
| Side | Class I (n = 50) | P | Class II Division 1 (n = 50) | P | Class II Division 2 (n = 50) | P | Class III (n = 50) | P | ||||||||||||||||
|---|---|---|---|---|---|---|---|---|---|---|---|---|---|---|---|---|---|---|---|---|---|---|---|---|
| Mean | SD | Mean difference | SE | t value | Mean | SD | Mean difference | SE | t value | Mean | SD | Mean difference | SE | t value | Mean | SD | Mean difference | SE | t value | |||||
| Right (mm) | 1.930 | 0.759 | −0.024 | 0.081 | −0.299 | 0.767 | 2.447 | 0.829 | −0.025 | 0.073 | −0.343 | 0.733 | 2.353 | 0.839 | −0.082 | 0.093 | −0.879 | 0.383 | 1.795 | 0.943 | 0.056 | 0.074 | 0.754 | 0.455 |
| Left (mm) | 1.954 | 0.717 | 2.472 | 0.732 | 2.435 | 0.951 | 1.738 | 1.027 | ||||||||||||||||
The Pearson correlation coefficient was calculated between overjet, overbite, L1-MP/S-MP, L7-MP/S-MP, and depth of the COS ( Table IV ). The results indicated statistically significant positive correlations between depth of the COS and L1-MP/S-MP (r = 0.541) and L7-MP/S-MP (r = 0.269) in Class I and Class III malocclusion groups. Also, a significant positive statistical relationship was found between depth of the COS and overjet (r = 0.483) and L7-MP/S-MP (r = 0.289) in the Class II Division 1 malocclusion group. In the Class II Division 2 group, all variables except overjet had positive correlations with depth of the COS.
| Group | Measurement | Mean | SD | r |
|---|---|---|---|---|
| Class I | Overjet (mm) | 3.358 | 0.982 | 0.234 |
| Overbite (mm) | 1.952 | 1.380 | 0.103 | |
| L1-MP/S-MP | 1.306 | 0.123 | 0.541 ‡ | |
| L7-MP/S-MP | 0.926 | 0.043 | 0.269 ∗ | |
| Class II, Division 1 | Overjet (mm) | 7.226 | 2.271 | 0.483 ‡ |
| Overbite (mm) | 2.626 | 1.832 | 0.085 | |
| L1-MP/S-MP | 1.337 | 0.095 | 0.219 | |
| L7-MP/S-MP | 0.909 | 0.053 | 0.289 ∗ | |
| Class II, Division 2 | Overjet (mm) | 4.546 | 1.262 | −0.175 |
| Overbite (mm) | 5.738 | 1.553 | 0.439 † | |
| L1-MP/S-MP | 1.344 | 0.086 | 0.268 ∗ | |
| L7-MP/S-MP | 0.959 | 0.056 | 0.467 ‡ | |
| Class III | Overjet (mm) | −0.564 | 2.592 | −0.102 |
| Overbite (mm) | 0.402 | 2.017 | 0.148 | |
| L1-MP/S-MP | 1.312 | 0.121 | 0.438 † | |
| L7-MP/S-MP | 0.861 | 0.083 | 0.175 |
Stay updated, free dental videos. Join our Telegram channel
VIDEdental - Online dental courses


