Introduction
The purposes of this study were to analyze long-term changes in anterior spacing and crowding and to compare the development in orthodontically treated and untreated subjects.
Methods
The sample comprised 308 adolescents in the late mixed or early permanent dentition who were examined clinically at the ages of 7 to 17 years and again 25 years later. The treated subgroup of 58 subjects had received orthodontic treatment with fixed or removable appliances or both. All subjects had a full complement of teeth, except for 19 who had premolar extractions as part of their orthodontic treatment plan.
Results
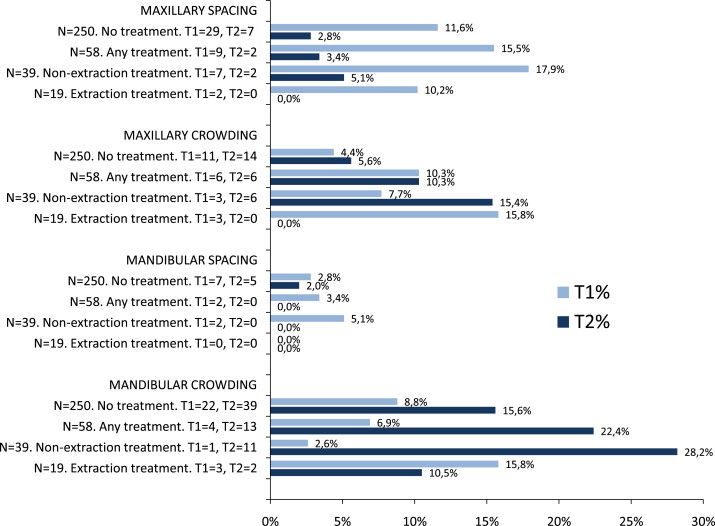
The prevalence of maxillary anterior spacing was substantially and significantly reduced in both the untreated and treated groups from the first examination to the second. The prevalence of mandibular crowding increased significantly in the untreated and the nonextraction treated groups. The prevalence of mandibular crowding in patients treated without extractions increased by 25.6%, significantly more than in the untreated controls. The prevalence of maxillary crowding decreased by 15.8% in patients treated with maxillary premolar extractions, significantly more than in the untreated controls.
Conclusions
Long-lasting developmental factors seem to result in universally reduced maxillary anterior spacing, orthodontic treatment notwithstanding. Compared with untreated subjects, the long-term development of mandibular anterior crowding was unfavorable in subjects treated without extractions. Compared with untreated subjects, the long-term development of maxillary anterior crowding was favorable when treatment included extraction of the maxillary premolars.
Several longitudinal studies have been conducted to describe the development of arch dimensions or space conditions in adolescents and adults, but large samples of untreated subjects with full dentitions are not easily obtained for repeated examinations in countries with adequate orthodontic services.
Comparisons between or with previous studies of untreated subjects are complicated and unreliable, since standardization of research approaches is minimal. The criteria vary, and the objectives can include intermolar arch widths, intercanine widths, arch lengths or perimeters, arch length discrepancy or space analysis, or incisor irregularity. Subjects might be randomly selected or limited to 1 class of occlusion. Subjects with missing teeth are usually excluded, but not always.
Most studies, but not all, describe the sexes separately or include tables comparing the sexes.
Some studies include development in the mixed dentition or late adolescence, whereas others are confined to adults after active growth. Studies on development in untreated subjects are for good reasons mostly longitudinal, but important information can also be derived from extensive cross-sectional population surveys.
In studies on treated subjects conducted to determine changes with orthodontic treatment and beyond, the many research approaches and variables in untreated subjects are repeated and then complicated further by diversity in the treatment procedures, retention protocols, and timing of treatment and examinations, as discussed previously.
Some aspects of posttreatment changes have been made clear in previous articles and summarized in discussions and reviews. Fundamental knowledge is still lacking, however, because of impeding factors such as individual variations in subject groups, the confounding effects of normal aging processes, and a general lack of experimental research with proper controls and randomization.
The purposes of this study were to analyze long-term changes in anterior spacing and crowding, and to compare the development in orthodontically treated and untreated subjects.
Material and methods
The original sample of randomly selected subjects comprised 1641 primary schoolchildren in Reykjavík, Iceland, examined clinically at the ages of 7 to 17 years. This study was based on 832 subjects (50.7%) from this sample who were available for a second examination 25 years later.
Sex, age, initial dental stage (DS), and treatment categories are described in Table I . DS 4 refers to subjects with all permanent teeth mesial to the first molars fully erupted, DS 3 subjects are in the late mixed dentition, and DS 2 subjects are in the intermediate mixed dentition with all permanent incisors fully erupted.
| Untreated | Nonextraction treatment | Extraction treatment | Total | |
|---|---|---|---|---|
| Total (n) | 250 | 39 | 19 | 308 |
| Male (n) | 90 | 17 | 5 | 112 |
| Female (n) | 160 | 22 | 14 | 196 |
| T1, DS 2 (n) | 26 | 6 | 3 | 35 |
| T1, DS 3 (n) | 99 | 26 | 10 | 135 |
| T1, DS 4 (n) | 125 | 7 | 6 | 138 |
| T1, mean age (y) | 11.8 | 10.7 | 10.7 | 11.6 |
| T1, age range (y) | 7-17 | 8-17 | 8-15 | 7-17 |
| Fixed appliance (n) | 0 | 15 | 17 | 32 |
| Removeable appliance (n) | 0 | 24 | 2 | 26 |
| T2, mean age (y) | 37.9 | 37.4 | 37.2 | 37.8 |
| T2, age range (y) | 33-43 | 34-42 | 34-41 | 33-43 |
All subjects with congenitally missing teeth were excluded, as were those who had lost any permanent teeth. Those who were in the early mixed dentition at the initial examination (T1) were also left out to eliminate the least mature of the initial group. The selection process therefore resulted in a longitudinal sample of 58 orthodontically treated and 250 fully dentate untreated subjects examined in adolescence and again 25 years later at the ages of 33 to 44 years.
The treated sample of 58 was then split into subgroups of 39 subjects treated without extractions and 19 subjects treated orthodontically with extractions of premolars.
In the subgroup of 19, there were 9 patients with maxillary extractions only, and 8 of these patients had the maxillary first premolar extracted. The other 10 subjects had 4 premolars extracted; there were maxillary first premolar extractions in 9 of the 10 patients and mandibular first premolar extractions in 6 of the 10 patients.
The T1 registrations were done by the second author (T.E.M.). He was also in charge of the second examination (T2), when the registrations were done by a qualified hygienist, after training and calibration. The registrations were carried out with a measuring instrument designed specifically to record occlusal traits and space condition according to the comprehensive method of Björk et al. The marking lines on the instrument are easily readable and limited to those that categorize the variables in question. Since the T2 examiner was uninformed about the treatment history of the subjects, any systematic or interexaminer bias would have affected to the same degree both treated and untreated subjects, the groups that were compared in this study. The registration method has been tested thoroughly for intraexaminer and interexaminer reliability, and has been used in several studies dealing with epidemiology and development of occlusion.
A detailed description of the material and methods was published previously.
Space anomalies were recorded according to the definitions of Björk et al, with a 2-mm criterion for spacing and crowding in the maxillary or mandibular anterior regions.
Statistical analysis
The data were analyzed with SPSS software (version 15.0, SPSS Sweden AB, Kista, Sweden). Space anomalies were expressed as dichotomous variables, and the Wilcoxon signed rank test used to analyze changes over time in each group, and the Mann Whitney U test was used to analyze differences between the groups.
Results
The Figure shows a strong decrease in maxillary anterior spacing in all subject groups, and Table II confirms that the change in maxillary spacing was significant in the untreated group, the combined treatment group of 58 subjects, and the nonextraction treatment group of 39 subjects. The Figure and Table II also show that the prevalence of mandibular anterior crowding increased significantly from T1 to T2 in the untreated group, the combined treatment group, and the nonextraction treatment group.
| T1 | T2 | T1 % | T2 % | Difference % | P value | T1 | T2 | T1 % | T2 % | Difference % | P value | |
|---|---|---|---|---|---|---|---|---|---|---|---|---|
| No orthodontic treatment n = 250 | Any orthodontic treatment n = 58 | |||||||||||
| Maxillary spacing ≥2 mm | 29 | 7 | 11.6 | 2.8 | −8.8 | 0.000 ‡ | 9 | 2 | 15.5 | 3.4 | −12.1 | 0.008 † |
| Maxillary crowding ≥2 mm | 11 | 14 | 4.4 | 5.6 | 1.2 | 0.491 | 6 | 6 | 10.3 | 10.3 | 0.0 | 1 |
| Mandibular spacing ≥2 mm | 7 | 5 | 2.8 | 2.0 | −0.8 | 0.480 | 2 | 0 | 3.4 | 0.0 | −3.4 | 0.157 |
| Mandibular crowding ≥2 mm | 22 | 39 | 8.8 | 15.6 | 6.8 | 0.002 † | 4 | 13 | 6.9 | 22.4 | 15.5 | 0.020∗ |
| Nonextraction orthodontic treatment n = 39 | Extraction orthodontic treatment n = 19 | |||||||||||
|---|---|---|---|---|---|---|---|---|---|---|---|---|
| Maxillary spacing ≥2 mm | 7 | 2 | 17.9 | 5.1 | −12.8 | 0.025∗ | 2 | 0 | 10.5 | 0.0 | −10.5 | 0.157 |
| Maxillary crowding ≥2 mm | 3 | 6 | 7.7 | 15.4 | 7.7 | 0.257 | 3 | 0 | 15.8 | 0.0 | −15.8 | 0.083 |
| Mandibular spacing ≥2 mm | 2 | 0 | 5.1 | 0.0 | −5.1 | 0.157 | 0 | 0 | 0.0 | 0.0 | 0.0 | 1 |
| Mandibular crowding ≥2 mm | 1 | 11 | 2.6 | 28.2 | 25.6 | 0.002 ‡ | 3 | 2 | 15.8 | 10.5 | −5.3 | 0.655 |
Table III compares the untreated group of 250 subjects with each of the treated groups. A higher prevalence of anomalies would be expected in the treated groups at T1, and this can be seen for most of the variables. A significantly higher prevalence in the treated groups at T1, however, was seen only in the comparison of maxillary crowding in the extraction treatment group of 19 patients vs 250 untreated subjects.
| T1 | T2 | |||||||||||
|---|---|---|---|---|---|---|---|---|---|---|---|---|
| 39 vs 250 | 19 vs 250 | 58 vs 250 | 39 vs 250 | 19 vs 250 | 58 vs 250 | |||||||
| Difference | P | Difference | P | Difference | P | Difference | P | Difference | P | Difference | P | |
| % | value | % | value | % | value | % | value | % | value | % | value | |
| Maxillary spacing ≥2 mm | 6.3 | 0.265 | −1.1 | 0.888 | 3.9 | 0.415 | 2.3 | 0.437 | −2.8 | 0.461 | 0.6 | 0.792 |
| Maxillary crowding ≥2 mm | 3.3 | 0.374 | 11.4 | 0.031∗ | 5.9 | 0.075 | 9.8 | 0.025∗ | −5.6 | 0.290 | 4.7 | 0.187 |
| Mandibular spacing ≥2 mm | 2.3 | 0.437 | −2.8 | 0.461 | 0.6 | 0.792 | −2.0 | 0.374 | −2.0 | 0.535 | −2.0 | 0.278 |
| Mandibular crowding ≥2 mm | −6.2 | 0.182 | 7.0 | 0.313 | −1.9 | 0.639 | 12.6 | 0.053 | −5.1 | 0.554 | 6.8 | 0.213 |
At T2, the nonextraction treated group of 39 subjects had a higher prevalence of maxillary crowding than did the untreated group.
Table IV describes the development in the treated groups, by using changes in the untreated group as the control. The development in the treated subjects was more favorable regarding most variables and significantly for maxillary crowding in the extraction treatment group of 19 subjects. Favorable in this context means decreased prevalence of the anomaly from T1 to T2. Development of mandibular crowding was, conversely, unfavorable in the nonextraction treatment group of 39 subjects.
| Baseline T1-T2 change n = 250 Untreated % | T1-T2 change in treated subjects and comparison with untreated control group | ||||||
|---|---|---|---|---|---|---|---|
| n = 39 Nonextraction treated | n = 19 Extraction treated | n = 58 All treated | |||||
| % | P | % | P | % | P | ||
| Maxillary spacing ≥2 mm | −8.8 | −12.8 | 0.463 | −10.5 | 0.822 | −12.1 | 0.482 |
| Maxillary crowding ≥2 mm | 1.2 | 7.7 | 0.202 | −15.8 | 0.013∗ | 0.0 | 0.797 |
| Mandibular spacing ≥2 mm | −0.8 | −5.1 | 0.176 | 0.0 | 0.843 | −3.4 | 0.314 |
| Mandibular crowding ≥2 mm | 6.8 | 25.6 | 0.002 † | -5.3 | 0.171 | 15.5 | 0.089 |
Stay updated, free dental videos. Join our Telegram channel
VIDEdental - Online dental courses


