Introduction
The goal of this study was to look at mandibular cortical bone in live patients using cone-beam computed tomography (CBCT) to determine differences in cortical plate thicknesses and mandibular cross-sectional height and width in patients with different vertical facial dimensions.
Methods
A total of 111 scanned patients were used. Of these subjects, 43 were included in the average vertical facial dimension group (average face), 34 in the high vertical facial group (long face), and 34 in the low vertical facial group (square short face). Cross-sectional slices of the mandible were developed with the cone-beam scans to evaluate the cortical bone between the dentition at 13 locations. Each section was then measured at 8 sites, which included 1 height and 2 width measures of the cross-sectional area and 5 cortical plate thicknesses. An analysis of variance (ANOVA) with a posthoc Bonferroni statistical analysis was used with a significance level of P ≤0.0167.
Results
The long-face group had slightly more narrow cortical bone than the other 2 facial groups at a few selected sites of the mandible. The height of the cross-sectional area of the mandible in the long-face group was shorter posteriorly than in the other 2 groups and became greater toward the symphysis.
Conclusions
Mandibular height and width differed more than cortical bone thickness among the 3 types of subjects with different vertical facial dimensions, but statistically significant differences were evident is some sites for cortical bone thickness.
The growth of the craniofacial region involves significant changes in the vertical facial dimension. While genetic factors can impose a dominant control, changes in function, as with chronic oral respiration, can induce an increase in the vertical facial dimension. Accompanying these dimensional changes are changes in the shape of the mandible, including alterations in the cortical bone. Cortical bone shape, thickness, and mineralization should alter with changes in loading by forces developed through the dentition and joint as the muscles contract during function. Cortical bone mineralization does vary with vertical facial dimension. The combined experimental animal and robotic studies, with mathematical models using finite element analysis, provide a concept that the mandible distorts, bends, and stretches during function, particularly during closing, biting, and chewing. Cortical bone thickness should respond to the complex functions of loading directly by the muscles attached to the mandible, as well as by the forces generated by the muscles to the articulating surfaces of the dentition and condyles so that muscles can provide forces to the cortical bone both directly and indirectly. The thickness of the cortical bone must respond to this functional loading and shape distortion and can provide insight as to the forces it experiences. This study, using cone-beam computed tomography (CBCT) in live subjects, provides a detailed analysis of how the cortical bone changes its thickness among 3 groups of patients depending on their vertical facial dimension and also addresses the concept of how gender modifies cortical bone thickness.
CBCT has emerged as a rapid, lower radiation CT analysis in which the software provides radiographic images in multiple slices as well as 3D volumetric images. The accuracy of measurements taken on a 3D model from a CBCT-rendered volumetric image is within a mean deviation of 0.13 ± 0.09 mm with a maximum deviation of 0.3 mm, which is acceptable. CBCT gives an accurate representation of a scanned object such as a human skull with substantial clinical usefulness.
The purpose of this project was to elucidate any differences in the cross-sectional morphology of the body of the short, average, and long face as it pertains to the thickness of lingual and buccal cortical plates and the height and width of the mandibular cross-sections in a broad selection of patients in California who received a CBCT scan. The hypothesis tested was that the thickness of the cortical plates was different among subjects with short, average, and long faces. We also assessed how the cortical bone thickness would vary between females and males.
Materials and methods
Subjects
This was a retrospective study of patients who received treatment at a university orthodontic clinic or were referred to a private radiology laboratory. A total of 111 subjects between the ages of 10 and 65 years was chosen for inclusion. These subjects were divided according to facial type: 43 with an average vertical facial dimension, 34 with a high vertical facial dimension (long face), and 34 with a low vertical facial dimension (square, short face). There were 67 female subjects and 44 male subjects. The distribution of male and female subjects among the 3 groups was 16 males and 18 females in the short-face group; 21 males and 23 females in the average-face group; and 6 males and 27 females in the long-face group. The distribution by age was not equal for the average- and long-face groups, which had a larger number of younger subjects, with a mean age of 15 years.
Inclusion criteria required that subjects have a complete dentition with or without third molars, with no remaining deciduous teeth, and symmetric mandibles. Exclusion criteria meant subjects with missing teeth, mandibular pathology, syndromes or diseases that may affect muscular skeletal function or development (such as temporomandibular disorders [TMD] or rheumatoid arthritis), obvious periodontal disease, or subjects receiving current orthodontic treatment were not enrolled. Institutional review board (IRB) approval was obtained to review records using the CBCT scanner. Subjects were not excluded based on dental molar relationship or sagittal skeletal relationship unless the deviations from normal were due to mandibular problems. All subjects were selected from previously scanned files. All patients meeting the inclusion criteria, who were not excluded and fitted into a single category of facial angle, were used. Of more than 500 total records, 111 met the inclusion criteria for this retrospective study.
Category criteria
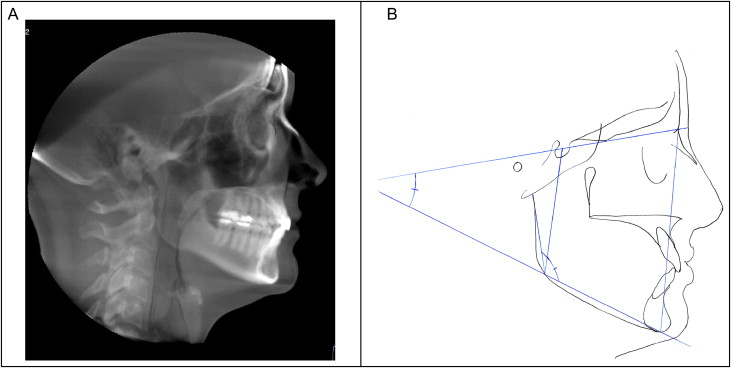
Facial type categories were determined from lateral head films evaluated cephalometrically and generated from CBCT scans with Hitachi’s CBWorks software (CBWorks 2.1, CyberMed Corp, Seoul, Korea) in conjunction with traditional cephalograms when available. All subjects had CBCT cephalograms, and 75 subjects had traditional cephalograms as well. Categories were determined by 2 measurements: facial height index and mandibular plane angle ( Fig 1 ). Facial height index (FHI) is the ratio of posterior facial height—to—anterior facial height using the measurements of the distance from sella (S) to gonion (Go) divided by the distance of nasion (N) to menton (Me). A short posterior facial height was determined by a ratio of less than 61% as defined by Horn. Average facial height has a posterior-to-anterior ratio between 61% and 69%. A long posterior height has a ratio of more than 69%. Those subjects with a long posterior facial height fell into the square, short-face group, and those with a short posterior facial ratio belonged in the long-face category. For those patients with a low ratio, the posterior facial length was nearly equal to the anterior facial length. The mandibular border in these patients was more closely parallel to the floor when the patient was in natural head position. The second measurement used to categorize patients was the mandibular plane angle. This is the angle formed from menton to gonion (Me-Go) and sella to nasion (S-N). A low angle was considered to be less than 27°, an average angle was between 27° and 37°, and a high angle was more than 37°. The categories for both FHI and mandibular plane angles were determined according to the norms and standard deviations used by the Dolphin 9.0 Imaging software (Dolphin Imaging & Management Solutions, Chatsworth, Calif). All cephalometric measurements on both the CBCT-derived cephalograms and standard cephalograms were conducted using Dolphin computerized software. Subjects had to fit into a single category for both measurements on both cephalometric radiographs in order to be kept in the study. Fourteen subjects who fell into mixed categories on a single cephalogram or between the 2 cephalograms were excluded.
Imaging and processing
Image acquisition
Images were obtained using the Hitachi MercuRay CBCT scanner (Hitachi Medico, Tokyo, Japan) at the university and with the iCAT CBCT scanner at a private radiology laboratory in Sacramento, Calif. Subjects sat upright as the x-ray tube and image acquisition screen rotated around the subject’s head. For the MercuRay, the scanner rotated for 10 seconds and was set at 110 kVp and 10 mA. For the iCAT, the settings were 120kVp at 8mA for a total scan time of 20 seconds. A total of 512 slices were acquired with each scan. The 3D image was reconstructed by the CBWorks 2.1 software and saved in digital imaging and communications in medicine (DICOM) format. DICOM files were downloaded and reconstructed using the CBWorks software. Images taken from both types of scanners were evaluated for their accuracy using skulls. CBCT cephalometric views were derived from the original scans using the CBWorks software. After opening the CBWorks program and choosing a head volume rendering (VR) preset, maximum intensity projection (MIP) was used with the “ray sum” feature to derive the image. Since some of the landmarks were difficult to visualize on the initial rendering, the images were adjusted using the “histogram tool” which adjusted saturation and contrast. Three-dimensional images and mandibular cross-sections were also obtained through the CBWorks software ( Fig 2 ).
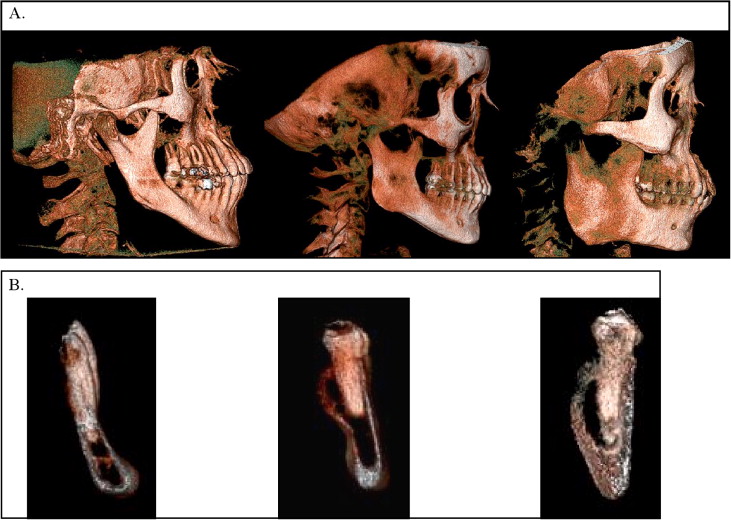
Image processing
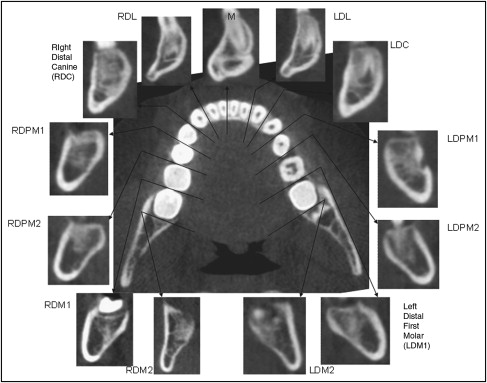
Subjects had a wide variety of mandibular plane angles, which would affect the cross-sections taken of the mandible. Those subjects with mandibles in the natural head position and whose mandibular lower border was nearly parallel to the floor would have a shorter cross-section than those with a steep angle. In order to correct for this factor, all subjects were reoriented using the “Z” subroutine in CBWorks so that when a line was drawn from Me to Go, it was parallel to the floor. Once the subjects’ images were reoriented so that the mandibular plane was parallel to the floor, the data were saved into the AVIA program (Hitachi, Tokyo, Japan) and downloaded to a disk. AVIA is a software package that loads onto the disk with the patient data. AVIA was specifically used because CBWorks 2.0 was unable to offer measurements less than 0.9 mm, and the DICOM data opened with the original dimensions. A total of 13 mandibular cross-sections were taken on each subject. Cross-sections were taken around the mandibular dental arch between teeth distal to the right second molar and proceeding to the distal position of the left second molar. Sections between the central and lateral incisors were not taken because of the close proximity of the roots of these teeth. The span between the mesial of the canine and the midline was not much greater than the span seen in the molar sections because of the decreased width of the crowns of these teeth. Figure 3 shows the 13 slices taken around a subject’s mandible with their correlating labels. The slices were named according to the side of the jaw (R or L); their position (D for distal); and which teeth including the lateral incisor (L), canine (C), first premolar (PM1), second premolar (PM2), first molar (M1), and second molar (M2). The slice taken through the midline of the symphysis was referred to as (M). As an example, “LDPM2” refers to the slice taken at the distal site of the left second premolar, and “RDM1” is the cut at the distal of the right first molar.
Measurements
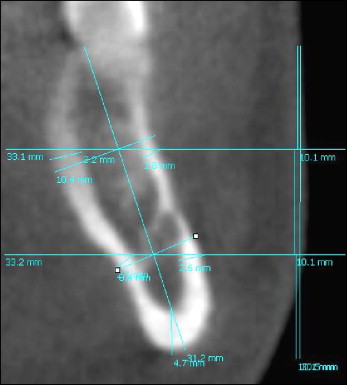
Each of the cross-sections had a total of 8 measurements taken ( Fig 4 ). The cortical bone was measured in 5 sites: 2 buccal, 2 lingual, and 1 at the base. One height and 2 width measurements were also recorded for each mandibular cross-sectional area. The length of the section was determined at a line drawn perpendicular to the mandibular plane. Two lines were extended perpendicular to this length and across the section at a distance one third and two thirds of the length. These 2 lines acted as reference points for the lingual and buccal cortical thickness recordings and were dropped from the line in the direction that the cross-section was angled. This method prevented false readings taken obliquely through the cortical plate. Nearly all sections except through the symphysis were angled lingually from the base of the mandible to the alveolar crest. The amount of angulation differed among patients, sections, and portions of the sections; measurements were angled to match. A fifth cortical bone reading was taken at the base of the mandible. The length of the mandibular cross-section was recorded from the top of the alveolar crest to the base of the mandible. It was drawn along the long axis of the section and placed approximately through the center of the slice. The width of the mandibular cross-section was taken at 2 places, using the same one third and two thirds reference lines used for the cortical plates. The widths were recorded perpendicular to the length measurement that was taken through the long axis. At the point where the length and reference lines crossed, the width lines also crossed.
Error measurements
Each subject had a total of 104 measurements taken, which were entered on an Excel (Microsoft Corp., Redmond, Wash) spreadsheet. Three operators—including the author, who was an orthodontic resident, and 2 dental students trained by the author—obtained data. The data were collected on 111 subjects. Operator 1 recorded results on 87 participants, operator 2 took measurements on 18 subjects, and operator 3 was responsible for the findings on 8 subjects. Operator 1 took the majority of patient measurements. The intraoperator error for operator 1 was obtained by repeating measurements on 10 randomly selected subjects. Interoperator error measurements were evaluated by having operators take measurements on the same subjects. These results were recorded in a spreadsheet and compared with Lin’s concordance correlation.
Intraoperator reliability
A total of 10 subjects’ measurements were repeated for intraoperator reliability for Operator 1. The average score of the 10 subjects was 0.997, which indicates nearly perfect repeatability using the AVIA software with a single examiner.
Interoperator reliability
Twenty patients were randomly chosen for repeatability between operators. A total of 8 subjects were measured between operators 1 and 2, 5 subjects were measured by both operators 1 and 3, and 7 subjects were measured between operators 2 and 3. The mean concordance between operators 1 and 2 was 0.987, with a high of 0.993 and a low of 0.979. The mean for operators 1 and 3 was 0.991, with a high of 0.996 and a low of 0.975. For operators 2 and 3, the average was 0.983, with a high of 0.992 and a low of 0.974. There was excellent correlation among the operators.
Statistical analysis
Statistical analysis among groups was performed using a separate analysis of variance (ANOVA) for each location with Bonferroni correction for the pairwise multiple comparisons among the 3 facial height groups, and with a significance level of P ≤0.0167. There was no correction for multiple endpoints. This commonly used multiple comparison test works well with a limited number of groups and is considered conservative. Lin’s concordance correlation determined interoperator and intraoperator error to determine reproducibility. It was used to determine agreement on a continuous measure between 2 operators or methods. A score of 1 indicated a perfect correlation, whereas 0 indicated no correlation at all. It differs from the Pearson correlation in that it measures departure from the 45° line of equivalence rather than just association. A linear correlation with 2 independent factors was completed to evaluate the effect of both age and vertical facial dimension.
A power analysis of the data was designed to have adequate power to apply a 2-sided statistical test of the research hypothesis that there was no difference in cortical bone thickness of the mandible in the 3 different facial groups. A type I error was specified at 5%, with a type II error of 10%. Based on the range of standard deviations and comparing the means between 2 groups, the power analysis predicted an N = 25 for those groups that were statistically different. There were 34 subjects in 2 facial groups, and 43 in the third group, providing enough subjects to compare the 3 facial groups.
Results
Patterns of cortical bone thickness
Figure 5 shows the mandibular cortical bone thickness at each of the 5 regions (A–E) of each of the 13 coronal slices measured and then divided into 3 groups of subjects separated by the vertical facial dimensions of short, average, and long face. The figure begins at the distal section of the right second molar in the upper buccal region (ie, A2MD R means region A is the upper buccal region of the second molar on the right side of the mandible) and moves around the mandible to the distal section of the left second molar ( A2MD L). This same pattern is continued through the lower buccal region (B), base of the mandible (C), lower lingual region (D), and upper buccal region (E). The thickest cortical bone is at the base of the mandible (C), followed by the upper buccal third, lower lingual third, lower buccal third, and finally the upper lingual third. A trend can be seen in which the long-face group has thinner cortical bone in almost all sites ( Table I ). Several areas of the mandible are statistically and significantly different among subjects with different vertical facial dimensions (22/65). In all areas, whether significant or not, the long-face group has the thinnest cortical bone. The square, short-face group has a thicker cortical plate in almost all regions of the buccal and lingual areas, with rare exceptions. The mandible has the thickest cortical bone in its base, with the most thickness below the lateral incisors and canines. The buccal bone is thicker in the posterior region around the molars. The lingual bone is more even in thickness, except for the lower lingual region at the symphysis, which is where the lingual bone is thickest.
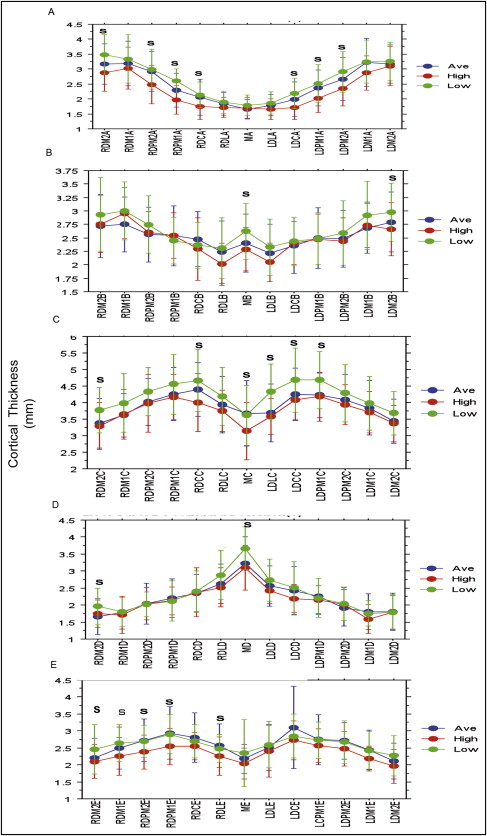
| Cortical bone site | Low face | Average face | High face | Low vs average vs high face |
|||
|---|---|---|---|---|---|---|---|
| Mean | SD | Mean | SD | Mean | SD | P <0.05 | |
| RDM2a | 3.52 | 0.68 | 3.16 | 0.65 | 2.85 | 0.63 | 0.001 |
| RDM2b | 2.95 | 0.68 | 2.72 | 0.58 | 2.74 | 0.54 | NS |
| RDM2c | 3.81 | 0.65 | 3.36 | 0.74 | 3.27 | 0.73 | 0.011 |
| RDM2d | 1.97 | 0.54 | 1.65 | 0.52 | 1.74 | 0.40 | 0.042 |
| RDM2e | 2.50 | 0.70 | 2.18 | 0.58 | 2.08 | 0.53 | 0.034 |
| RDM1a | 3.34 | 0.78 | 3.22 | 0.77 | 2.99 | 0.70 | NS |
| RDM1b | 2.99 | 0.53 | 2.78 | 0.52 | 2.94 | 0.47 | NS |
| RDM1c | 3.95 | 0.78 | 3.66 | 0.76 | 3.63 | 0.77 | NS |
| RDM1d | 1.80 | 0.41 | 1.78 | 0.49 | 1.69 | 0.55 | NS |
| RDM1e | 2.69 | 0.51 | 2.48 | 0.61 | 2.22 | 0.56 | 0.011 |
| RDPM2a | 3.03 | 0.70 | 2.90 | 0.62 | 2.46 | 0.64 | 0.003 |
| RDPM2b | 2.74 | 0.53 | 2.59 | 0.51 | 2.59 | 0.39 | NS |
| RDPM2c | 4.32 | 0.71 | 4.06 | 0.72 | 3.94 | 0.88 | NS |
| RDPM2d | 2.02 | 0.37 | 2.05 | 0.60 | 2.02 | 0.48 | NS |
| RDPM2e | 2.70 | 0.46 | 2.72 | 0.63 | 2.36 | 0.51 | 0.027 |
| RDPM1a | 2.63 | 0.41 | 2.30 | 0.56 | 1.92 | 0.41 | 0.001 |
| RDPM1b | 2.47 | 0.45 | 2.54 | 0.55 | 2.51 | 0.41 | NS |
| RDPM1c | 4.57 | 0.91 | 4.27 | 0.79 | 4.14 | 0.69 | NS |
| RDPM1d | 2.15 | 0.58 | 2.20 | 0.56 | 2.09 | 0.43 | NS |
| RDPM1e | 2.90 | 0.55 | 2.93 | 0.79 | 2.54 | 0.59 | NS |
| RDCa | 2.18 | 0.43 | 2.04 | 0.59 | 1.72 | 0.43 | 0.003 |
| RDCb | 2.37 | 0.42 | 2.47 | 0.51 | 2.29 | 0.59 | NS |
| RDCc | 4.69 | 0.92 | 4.39 | 0.80 | 3.98 | 0.89 | 0.012 |
| RDCd | 2.41 | 0.60 | 2.37 | 0.55 | 2.24 | 0.73 | NS |
| RDCe | 2.70 | 0.54 | 2.79 | 0.70 | 2.56 | 0.41 | NS |
| RDL2a | 1.93 | 0.36 | 1.82 | 0.39 | 1.69 | 0.33 | NS |
| RDL2b | 2.34 | 0.55 | 2.21 | 0.58 | 2.01 | 0.39 | NS |
| RDL2c | 4.19 | 0.86 | 3.94 | 0.85 | 3.76 | 0.63 | NS |
| RDL2d | 2.91 | 0.71 | 2.61 | 0.58 | 2.50 | 0.59 | NS |
| Ma | 1.82 | 0.33 | 1.65 | 0.30 | 1.68 | 0.38 | NS |
| Mb | 2.64 | 0.49 | 2.42 | 0.55 | 2.25 | 0.39 | 0.014 |
| Mc | 3.63 | 0.91 | 3.64 | 0.98 | 3.16 | 0.87 | 0.010 |
| Md | 3.67 | 0.57 | 3.25 | 0.80 | 3.07 | 0.66 | 0.005 |
| Me | 2.35 | 0.98 | 2.17 | 0.43 | 2.04 | 0.45 | NS |
Stay updated, free dental videos. Join our Telegram channel
VIDEdental - Online dental courses


