Introduction
The purpose of this study was to evaluate the reliability and accuracy in locating several different foramina in the cranial base by using cone-beam computerized tomography (CBCT) images for future use in establishing reference coordinate systems.
Methods
CBCT images from 10 dry skulls were taken with and without the foramina ovale, spinosum, and rotundum, and the hypoglossal canals filled with radiopaque gutta-percha (gold standard). Three evaluators identified the foramen landmarks in the CBCT images without gutta-percha. Mean differences and main researcher intraexaminer and interexaminer reliability were measured by using intraclass correlation coefficients for all landmark coordinates. Descriptive statistics were calculated with respect to the landmark coordinates and distances to the reference points.
Results
Intraexaminer and interexaminer reliability values for the x-, y-, and z-coordinates for all landmarks were greater than 0.9 with the exception of 4 (of 72) points that still had acceptable interexaminer reliability (>0.75). Mean measurement error differences obtained in the principal investigator’s trials were primarily less than 0.5 mm. When comparing the mean distance differences of the same examiner and between the 3 examiners with the gold standard, the highest difference obtained was 1.3 mm.
Conclusions
Foramina spinosum, ovale, and rotundum, and the hypoglossal canal all provided high intraexaminer reliability and accuracy, and can be considered acceptable landmarks to use in establishing reference coordinate systems for future 3-dimensional superimposition analysis.
Cephalometric image analysis is a 2-dimensional (2D) type of diagnostic rendering taken of a 3-dimensional (3D) structure and is subject to projection, landmark identification, and measurement errors. Landmark identification errors are specifically influenced by many factors such as quality of the radiographic image, landmark definition, reproducibility of the landmark location, operator, and registration procedures. Furthermore, lateral cephalograms are difficult to accurately superimpose because of the difference between the right and left sides, such as differences in scaling ratios, variations in head positioning, and overlapping of various cranial structures.
Advances in the use of 3D imaging have greatly improved the visualization of craniofacial structures. Several 3D computer methods have been developed to assist in orthodontic diagnosis and predict the results of treatment. Nevertheless, these methods have potential analysis problems, since there are few accepted standards or conventions for managing computational data in the maxillofacial complex.
Several authors have stated that superimposition of 3D images could be an alternative method to analyze changes during and after treatment, but it depends on the choice of superimposition landmark locations ; the best locations are those on anatomic surfaces that are simpler to locate in 3D space. It is important to select stable areas and structures as registration points or landmarks that remain unchanged during orthodontic treatment to make pretreatment and posttreatment superimpositions. Defining a standardized coordinate system in which reference points lie in the cranial base has been proposed with the use of both foramina spinosum. The purpose of this study was to evaluate the reliability and accuracy in locating several foramina in the cranial base.
Material and methods
Ten dry skulls with no apparent distortions in the cranial base were used for this study. A cone-beam computerized tomography (CBCT) scan was then taken of each skull by using the NewTom 3G (Aperio Services, Verona, Italy) at 110 kV, 6.19 mAs, and 8-mm aluminum filtration. Since the dry skulls had no soft-tissue components, and therefore the image obtained from the CBCT machine would be too dark to be analyzed, a phantom acrylic plastic box (26 × 24.6 × 22 cm) was manufactured to encapsulate the model. The box had divisions at the base (5.1 cm wide) and sides (2.5 cm wide each side). The box divisions were filled with water to simulate soft tissues around the skulls. This box design gave an artificial attenuation value of soft tissues without modifying the setting of the CBCT machine. The dry skulls were placed in the box facing upward and centered by using the NewTom’s laser light system, imitating the clinical scenario. The skulls were positioned and stabilized with putty.
Images were reconstructed by using a voxel size of 0.25 mm. After obtaining the first image for each skull, left and right foramina ovale, spinosum, and rotundum, and the hypoglossal canals were filled with gutta-percha (Gutta Percha Points #120, Dentsply-Maillefer, Tulsa, Okla). The dry skulls were positioned back in the NewTom as previously described, and a second image was taken of each skull. The skulls were repositioned by using the imprint left in the putty and again with the NewTom positioning lasers. The gutta-percha did not create artifacts, or these were mild when viewing the CBCT images.
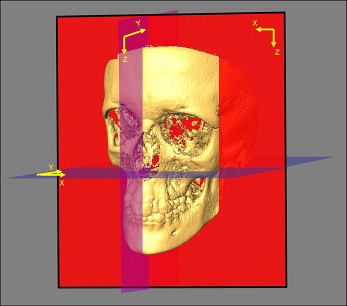
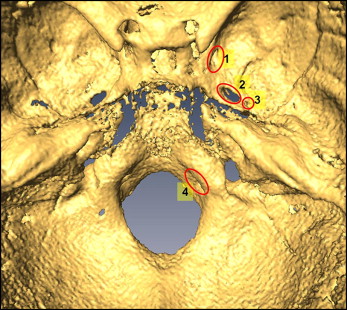
Images were processed and saved in DICOM (digital imaging and communications in medicine) format. By using AMIRA software (Mercury Computer Systems, Berlin, Germany), these images were rendered into volumetric images. With the skull viewed from the frontal perspective, the x-axis was defined as the transverse dimension, the y-axis was defined as the anterior posterior dimension, and the z-axis represented the vertical dimension. Sagittal, axial, and coronal volumetric slices as well as the 3D reconstruction of the image were used for landmark positioning. When changing image orientation in the software, the coordinate system rotates with it, resulting in no change in the axes ( Fig 1 ). For blinding, each CBCT image set was assigned a reference number, and the images were assessed in random order. The principal investigator (M.O.L.) located the landmarks during 3 trials for both skulls with and without gutta-percha; the trials were 1 week apart. Two other investigators (J.M.G. and C.F.M.) also located the landmarks for each skull once. A description and a definition of each landmark and measurement obtained are provided in Table I ( Fig 2 ).
| Foramen spinosum left: the geometric center of the smallest circumference with defined borders in the axial view on the foramen spinosum left. |
| Foramen spinosum right: the geometric center of the smallest circumference with defined borders in the axial view on the foramen spinosum right. |
| Ovale left: the geometric center of the smallest oval shape with defined borders in the axial view on the ovale left. |
| Ovale right: the geometric center of the smallest oval shape with defined borders in the axial view on the ovale right. |
| Hypoglossal canal left: the geometric center of the smallest circumference with defined borders in the sagittal view of the hypoglossal canal left. |
| Hypoglossal canal right: the geometric center of the smallest circumference with defined borders in the sagittal view of the hypoglossal canal right. |
| Rotundum left: the center lower border of the meatus of the left canal as it enters the cranial fossa. |
| Rotundum right: the center lower border of the meatus of the right canal as it enters the cranial fossa. |
Absolute values of the differences between each trial for every axis of every landmark were averaged, and means, standard deviations, and mean ranges are reported in Table II ( Fig 3 ). Intraexaminer and interexaminer reliability values were determined by using intraclass correlation coefficients. For interexaminer reliability, trials from the 2 authors and the second trial of the first author were used. To assess clinical significance, landmark identification errors for the x-, y-, and z-axes were determined for the skulls with and without the gutta-percha filling the foramina. Linear distances from 4 reference landmarks to the cranial base foramen landmarks with gutta-percha defining the foramina (gold standard) were compared with the linear distances without gutta-percha to determine landmark accuracy. Three reference landmarks (reference , , and ) were represented by metal markers in the cranial calvarium, and one was represented by the maxillary right central incisor mesial crown tip (reference ) ( Fig 3 ). These distances were determined by using the equation:
distance = [ ( x 1 − x 2 ) 2 + ( y 1 − y 2 ) 2 + ( z 1 − z 2 ) 2 ] .
Stay updated, free dental videos. Join our Telegram channel
VIDEdental - Online dental courses


