Introduction
The purpose of this study was to assess age, sex, and regional differences in the cortical bone thickness of commonly used maxillary and mandibular miniscrew implant placement sites.
Methods
Cone-beam computed tomography images, taken at 0.39-mm voxel size, of 52 patients, including 26 adolescents (13 girls, ages 11-13; 13 boys, ages 14-16) and 26 adults (13 men and 13 women, ages 20-45), were evaluated. The cone-beam computed tomography data were imported into 3-dimensional software (version 10.5, Dolphin Imaging Systems, Chatsworth, Calif); standardized orientations were used to measure cortical bone thickness at 16 sites representing the following regions: 3 paramedian palate sites, 1 infrazygomatic crest site, 4 buccal interradicular sites of the mandible, and 4 buccal and 4 lingual interradicular sites in the maxilla.
Results
Multivariate analysis of variance (MANOVA) showed no significant differences in cortical bone thickness between the sexes. There were significant ( P <0.05) differences between adolescents and adults, with adult cortices significantly thicker in all areas except the infrazygomatic crest, the mandibular buccal first molar-second molar site, and the posterior palate site. Cortical bone was thicker in the posterior than in the anterior mandibular sites. In the adults, interradicular bone in the maxillary first premolar-second premolar, and second premolar-first molar sites was thicker than bone at the lateral incisor-canine and first molar-second molar sites. Anterior paramedian palatal bone was significantly thicker than bone located more posteriorly. The mandibular buccal and infrazygomatic crest regions had the thickest cortical bone; differences between the maxillary buccal, the maxillary lingual, and the palatal regions were small.
Conclusions
Maxillary and mandibular cortical bones at commonly used miniscrew implant placement sites are thicker in adults than in adolescents. There are also differences in cortical bone thickness between and within regions of the jaws that must be considered when placing miniscrew implants.
Miniscrew implants (MSIs), used by approximately 80% of orthodontists, make treatments better for approximately 78% of the orthodontists recently surveyed. MSIs are commonly placed into the maxillary and mandibular buccal alveolar bones to improve anchorage, to increase the horizontal component of applied force during space closure, and for posterior intrusion in open-bite patients. MSIs have been placed into the infrazygomatic crest for space closure, posterior intrusion, and distalization. They have also been placed in the palatal alveolar bone and the paramedian palate.
The loosening and failure of MSIs are major limitations for their use. Important risk factors for MSI failure include placement in the mandible, placement in thin (<1 mm) cortical bone, and placement torque values outside the 5 to 10 Ncm range. According to Costa et al and Miyawaki et al, cortical bone quality and quantity are major factors associated with primary stability of MSIs, probably because it is achieved by mechanical retention rather than osseointegration. Wilmes et al found that cortical bone thickness has a strong effect on the primary stability of MSIs. Placement torque and pullout strength of MSIs have also been correlated with cortical bone thickness. Clinically, MSI failures have been reported to result from thin cortical bone. Miyamoto et al suggested that cortical bone thickness plays a greater role in determining stability than implant length.
Although well-controlled studies have not been performed, it appears that MSIs placed in younger or adolescent patients tend to fail more often than those placed in adults. Chen et al concluded that placing MSIs in younger patients was a primary risk factor associated with their failure. Park et al, who placed MSIs in subjects from 11 to 28 years of age, observed failures only in patients younger than 14 years. Garfinkle et al reported a much lower overall MSI success rate (70.3%) in adolescent patients than did other studies evaluating adults. Motoyoshi et al reported their lowest success rate (63.8%) for adolescent patients. Because age differences in cortical bone thickness have not been systematically studied, it is unclear whether cortical thickness could explain the differences in the failures observed.
It is also important for the clinician placing MSIs to be aware of any differences in cortical bone thickness between and within regions of the jaws. Thicker cortical bone has been reported for the mandible than the maxilla. There also appear to be differences in each jaw, with the thickest cortical bone in the molar region, followed by the premolar and incisor regions, respectively. Bone in the mandibular buccal region has also been reported to be thicker than bone in the mandibular lingual region. Although specific sites and regions have been evaluated, there is no comprehensive assessment of cortical bone thickness at common MSI placement sites of both the maxilla and the mandible.
The purpose of this study was to examine the cortical bone thickness at common sites of MSI placement in patients before treatment. The hypotheses were that there are no differences in cortical bone thickness between adolescents and adults, between the sexes, between sites within regions, or between regions of the maxilla and the mandible.
Material and methods
Pretreatment cone-beam computed tomography (CBCT) scans (CB MercuRay, Hitachi International, Tokyo, Japan), taken in the orthodontic department of University of Nevada, Las Vegas., were evaluated to identify 52 consecutive patients, including 2 groups comprising 26 adolescents (13 girls, 11-13 years of age; 13 boys, 14-16 years of age) and 26 adults (13 men and 13 women, 20-45 years of age). The scans were selected according to the age requirements, a 0.39-mm voxel size, and the following exclusion criteria: (1) missing or unerupted permanent teeth in the quadrant measured, (2) periapical or periradicular pathologies or radiolucencies of either periodontal or endodontic origin, (3) a significant medical or dental history (eg, use of bisphosphonates or bone-altering medications, or diseases), (4) severe facial or dental asymmetries, and (5) vertical or horizontal periodontal bone loss.
The CBCT scans were imported into 3-dimensional software (version 10.5, Dolphin Imaging Systems, Chatsworth, Calif) for analysis as digital imaging and communications in medicine (DICOM) multi-files. The thickness of the buccal cortical plates of the maxilla and the mandible were measured in the interradicular areas between the (1) lateral incisor and canine (2-3), (2) first and second premolars (4-5), (3) second premolar and first molar (5-6), and (4) first and second molars (6-7). The lingual cortical plate of the maxilla was measured at the same 4 locations. The lingual cortical plate in the mandible was not measured because of its limited use for MSI placement. The interradicular measurements were made 4 mm apical to the alveolar crest, which is approximately at the level of the mucogingival junction. All interradicular sites selected for measurement have been previously used for MSI placement.
The infrazygomatic crest of the maxilla was also measured. The cortical thickness at the level of the mesiobuccal cusp of the maxillary first molar was selected based on the work of Liou et al.
The paramedian palate was measured 3, 6, and 9 mm dorsal and 3 mm lateral to the incisive foramen. The paramedian palate sites were chosen based on a study of palatal bone thickness, which showed that these areas have sufficient bone to avoid nasal perforation on MSI placement.
For each patient, either the right or the left quadrant of the maxilla and the mandible was randomly chosen for the measurements. Only 1 side was measured because it was previously shown that there are no differences in cortical thickness between sides of the jaws.
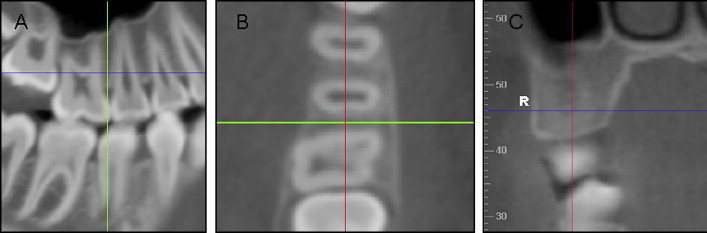
Before measurement, each site was oriented in all 3 planes of space. For the measurements made in the posterior interradicular areas of the maxilla and mandible, the sagittal slice was used to locate the interradicular area of interest ( Fig 1 , A ). The slice was then oriented so that the vertical reference line bisected the interradicular space and was parallel to the long axes of the roots. The axial slice was then used to ensure that the horizontal reference line traversed the thinnest area of cortical bone while bisecting the interradicular area ( Fig 1 , B ). The vertical level of the measurement was established 4 mm apical to the crest of the alveolar bone by using the coronal slice. This was accomplished by moving the horizontal reference line based on the millimeter rule at the border of the frame. By using the coronal slice, the final measurements were made through the thinnest portion of the cortical bone where the horizontal reference line contacted the endosteal surface ( Fig 1 , C ).
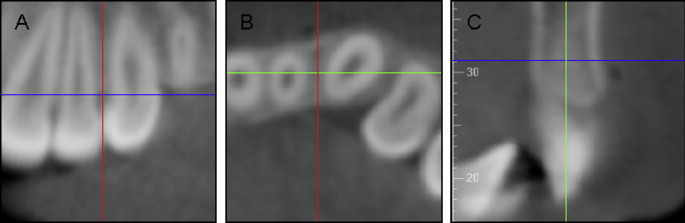
For the anterior maxilla and mandible, the coronal slice was used to locate the interradicular area, with the vertical reference line oriented parallel to the adjacent roots and bisecting the interradicular space ( Fig 2 , A ). The axial slice was then used to orient the vertical reference line through the thinnest area of cortical bone while bisecting the interradicular area ( Fig 2 , B ). The sagittal slice was then oriented so that the vertical reference line bisected the alveolar bone, and the horizontal reference line was moved to be 4 mm from the alveolar crest. The measurements were made by using the sagittal slice through the thinnest portion of the cortical bone ( Fig 2 , C ).
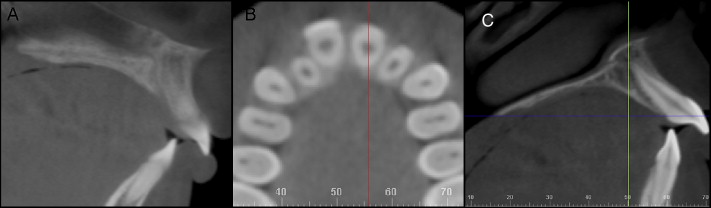
The measurements at the paramedian palate were made by using a protocol similar to that described by Kang et al. First, the sagittal slice was used to localize the incisive canal ( Fig 3 , A ). The axial slice was then used to define a horizontal position 3 mm to the right of the midline ( Fig 3 , B ). The sagittal slice was then oriented so that the horizontal reference line contacted the lingual crest of the maxillary alveolar bone and the posterior nasal spine. By using the sagittal view, the vertical reference line was moved 3, 6, and 9 mm dorsal to the incisive canal. Cortical thickness was measured as the shortest distance between the endosteal and periosteal surfaces at each of these 3 sites ( Fig 3 , C ).
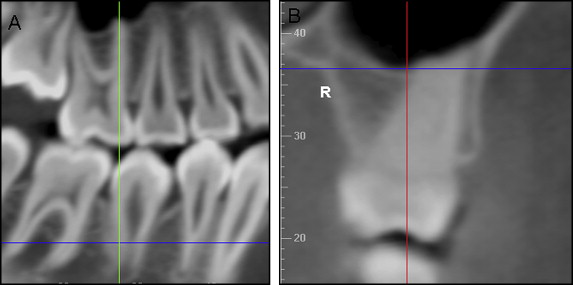
For the infrazygomatic crest measurement, the sagittal slice was used to orient the vertical reference line along the long axis of the mesiobuccal root of the maxillary first molar ( Fig 4 , A ). The vertical dimension of the measurement was then established in the coronal slice by locating the junction of the cortical plates of the maxillary sinus and the infrazygomatic crest of the maxilla. By moving the horizontal reference line 2 mm in a coronal direction from that junction, thickness was measured by using the coronal plane at the thinnest aspect of the cortical bone where the horizontal reference line contacted the endosteal surface ( Fig 4 , B ).
A second set of measurements was taken at each site in 20 randomly selected patients approximately a month after the first set of measurements. Of the 16 sites measured, only the 6-mm palatal site showed a significant systematic difference between the initial and replicate measurements, but the difference was small (0.10 mm). Method errors (√[Σdeviations 2 /2n]) of the replicate measures ranged from 0.09 to 0.15 mm.
To ensure that the scans with the 0.39-mm voxel size were sufficiently precise, a pilot study was conducted to compare differences in the reliabilities of cortical thickness measurements made from CBCT scans with 0.2-mm and 0.4-mm voxel size resolutions.
One porcine ( Sus domestica ) head was sectioned coronally posterior to the first molars by using a reciprocating saw (DeWalt, Baltimore, Md). Sectioning was necessary to fit the head in the physical rotational limits of the i-CAT machine (Imaging Sciences International, Hatfield, Pa). A Cavitron (Dentsply/Cavitron, York, Pa) ultrasonic scaler was used, along with various manual scalers and curettes, to remove calculus from the teeth. The head was secured in a standard position (with the occlusal plane parallel to the ground) on a custom platform designed to rest on the guide ring of the i-CAT machine. Two scans were taken at 2 resolutions (0.20-mm and 0.40-mm voxel sizes).
The CBCT scans of the porcine head were oriented according to the protocol previously described for interradicular measurements. Twelve sites were each measured 5 times for both voxel sizes.
Statistical analysis
Based on the skewness and kurtosis statistics, the distributions were judged to be normal. A 2-way multivariate analysis of variance (MANOVA) was used to evaluate age group and sex differences. Paired t tests were used to evaluate differences between and within regions. The cortical thickness of the sites in each region were averaged to evaluate differences between the 5 regions. Interclass correlations evaluated the reliabilities of the measurements made at the 0.20-mm and 0.40-mm voxel sizes.
Results
The 5 replicate measurements taken at each of the 12 sites showed high reliability for both the 0.2-mm and 0.4-mm scans. Interclass correlations for the 0.2-mm and 0.4-mm voxel sizes were 0.995 ( P <0.001) and 0.994 ( P <0.001), respectively.
The MANOVA showed no significant interaction and no significant sex differences in cortical thickness. There were significant ( P <0.001) differences between adolescents and adults; adult cortices were significantly thicker in all areas except the infrazygomatic crest, the mandibular buccal cortex between the first and second molars, and the posterior (9 mm) paramedian palate ( Table I ). In the interradicular regions, the differences between adolescents and adults tended to increase from anterior to posterior ( Fig 5 ). In the maxilla, age group differences in cortical thickness were greater at the 5-6 than at the 6-7 sites. The age group differences in palatal cortical thickness at the 3-mm and 6-mm sites were similar.
| Jaw | Cortex | Site | Adolescents | Adults | Age group difference | |||
|---|---|---|---|---|---|---|---|---|
| Mean (mm) | SD | Mean (mm) | SD | Mean | P value | |||
| Mandible | Buccal | 2-3 | 0.86 | 0.07 | 1.20 | 0.18 | 0.35 | <0.001 |
| 4-5 | 1.26 | 0.26 | 1.68 | 0.24 | 0.48 | <0.001 | ||
| 5-6 | 1.40 | 0.36 | 1.91 | 0.35 | 0.52 | <0.001 | ||
| 6-7 | 2.38 | 0.31 | 2.49 | 0.34 | 0.11 | 0.226 | ||
| Maxilla | Buccal | 2-3 | 0.96 | 0.21 | 1.20 | 0.35 | 0.24 | 0.034 |
| 4-5 | 1.06 | 0.21 | 1.33 | 0.24 | 0.27 | <0.001 | ||
| 5-6 | 1.01 | 0.19 | 1.45 | 0.28 | 0.44 | <0.001 | ||
| 6-7 | 0.85 | 0.10 | 1.26 | 0.24 | 0.41 | <0.001 | ||
| Lingual | 2-3 | 1.05 | 0.23 | 1.17 | 0.12 | 0.12 | <0.001 | |
| 4-5 | 0.97 | 0.26 | 1.38 | 0.30 | 0.41 | <0.001 | ||
| 5-6 | 0.98 | 0.25 | 1.53 | 0.34 | 0.56 | <0.001 | ||
| 6-7 | 0.91 | 0.11 | 1.26 | 0.35 | 0.35 | <0.001 | ||
| Palate | 3 mm | 1.25 | 0.28 | 1.42 | 0.29 | 0.17 | 0.028 | |
| 6 mm | 1.07 | 0.28 | 1.24 | 0.28 | 0.17 | 0.033 | ||
| 9 mm | 0.98 | 0.39 | 1.19 | 0.42 | 0.20 | 0.074 | ||
| Infrazygomatic crest | 1.44 | 0.39 | 1.58 | 0.34 | 0.13 | 0.185 | ||
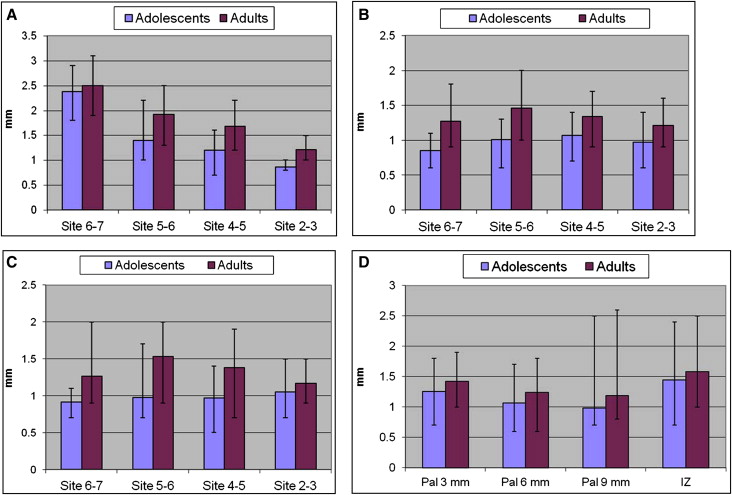
There were significant differences in cortical thickness between sites in each region ( Fig 5 ). Bone at the mandibular buccal 6-7 site was consistently significantly thicker than bone at the 5-6 site, which was thicker than bone at the 4-5 site, which was in turn thicker than bone at the 2-3 site. Adults showed similar differences in the maxillary buccal and lingual regions; the 2-3 site was significantly thinner than the 4-5 and 5-6 sites; the 5-6 site were significantly thicker than the 4-5 and 6-7 sites. Adolescents had significantly thicker bone at the maxillary buccal and lingual 2-3 sites than at the 6-7 site; maxillary buccal bone of adolescents at the 4-5 site was also significant thicker than bone at the 6-7 site. In the palatal region, the 3-mm site was significantly thicker than both the 6-mm and 9-mm sites. Variability between subjects was great, with differences in cortical bone thicknesses ranging from 0.2 to 1.8 mm in adolescents and 0.5 to 1.8 mm in adults.
There were statistically significant ( P <0.05) differences between most regions ( Table II ). For adolescents, the thickest region was the mandibular buccal (1.46 ± 0.17 mm), followed by the infrazygomatic crest (1.45 ± 0.39 mm), the palate (1.10 ± 0.25 mm), the maxillary lingual (0.98 ± 0.14 mm), and the maxillary buccal (0.97 ± 0.13 mm) areas, respectively. Adults also showed the thickest cortical bone in the mandibular buccal region (1.82 ± 0.17 mm), followed by the infrazygomatic crest, the maxillary lingual (1.34 ± 0.24 mm), the maxillary buccal (1.32 ± 0.21 mm), and the palate (1.29 ± 0.25 mm). The cortical bone of the mandibular buccal region was significantly thicker than the cortical bone in the maxillary buccal, maxillary lingual, and palatal regions. Bone at the infrazygomatic crest was also thicker than bone in the maxillary buccal, maxillary lingual, and palatal reigons. Mandibular buccal bone was significantly thicker than infrazygomatic bone in adults, but not in adolescents. In contast, adolescents showed significant differences between the maxillary buccal and palatal regions, whereas adults did not.


