Introduction
Disordered craniofacial development frequently results in definitive facial asymmetries that can significantly impact a person’s social and functional well-being. The mandible plays a prominent role in defining facial symmetry and, as an active region of growth, commonly acquires asymmetric features. Additionally, syndromic mandibular asymmetry characterizes craniofacial microsomia (CFM), the second most prevalent congenital craniofacial anomaly (1:3000 to 1:5000 live births) after cleft lip and palate. We hypothesized that asymmetric rates of mandibular growth occur in the context of syndromic and acquired facial asymmetries.
Methods
To test this hypothesis, a spherical harmonic-based shape correspondence algorithm was applied to quantify and characterize asymmetries in mandibular growth and remodeling in 3 groups during adolescence. Longitudinal time points were automatically registered, and regions of the condyle and posterior ramus were selected for growth quantification. The first group (n = 9) had a diagnosis of CFM, limited to Pruzansky-Kaban type I or IIA mandibular deformities. The second group (n = 10) consisted of subjects with asymmetric, nonsyndromic dentofacial asymmetry requiring surgical intervention. A control group (n = 10) of symmetric patients was selected for comparison. A linear mixed model was used for the statistical comparison of growth asymmetry between the groups.
Results
Initial mandibular shape and symmetry displayed distinct signatures in the 3 groups ( P <0.001), with the greatest asymmetries in the condyle and ramus. Similarly, mandibular growth had unique patterns in the groups. The dentofacial asymmetry group was characterized by significant asymmetry in condylar and posterior ramal remodeling with growth ( P <0.001). The CFM group was characterized by asymmetric growth of the posterior ramus ( P <0.001) but relatively symmetric growth of the condyles ( P = 0.47).
Conclusions
Forms of CFM are characterized by active and variable growth of the dysplastic side, which has a distinct pattern from other disorders of mandibular growth.
Highlights
- •
We assessed mandibular growth and remodeling asymmetries in adolescents.
- •
Condylar growth rates were similar bilaterally in those with craniofacial microsomia (CFM).
- •
Growth of the dysplastic condyle in CFM is directed laterally.
- •
Remodeling of the posterior ramus is decreased on the dysplastic side in CFM.
- •
In noncongenital dentofacial deformity, mandibular growth is more unilateral and condylar.
The mandible is the primary moving and functioning bone in the craniofacial skeleton and consequently plays a central role in defining facial morphology and symmetry. In active regions of growth, dysplasia during childhood can lead to severe facial deformity. Asymmetric mandibular growth occurs in the context of a diverse set of congenital and acquired conditions, including craniofacial microsomia (CFM) and hemimandibular hyperplasia or hypertrophy. The unpredictable nature of asymmetric growth, often affecting symmetry in all 3 planes of space, creates a particular challenge for planning surgical and orthodontic treatment strategies. CFM is the second most common congenital craniofacial anomaly after cleft lip and palate, occurring in 1:3000 to 1:5000 live births. Derivatives of the first and second branchial arches are affected in a unilateral pattern. Thus, skeletal, neuromuscular, and other soft tissue components are affected. To a varying extent, these may include the ear, mandibular ramus, condyle, glenoid fossa, and associated muscles and nerves. Additionally, ocular, renal, spinal, and cardiac involvements may be present. Disruptions of cranial neural crest cell migration or proliferation during development are strongly implicated as potential etiologic factors.
Disordered mandibular growth can be broadly categorized based on etiology as (1) congenital disorders of development, (2) primary growth disorders, and (3) disorders related to acquired trauma or disease. The growth patterns in CFM are complex, involving all 3 planes of space. In some patients, the affected side shows less growth relative to the unaffected side, whereas in others, there is significant compensatory growth. The associated neuromuscular derivatives are also affected to varying degrees and tend to grow less than the contralateral side. In severe cases (types IIB and III of CFM ), the absence of structures important to growth, including condyle, ramus, and masticatory muscles, results in greatly diminished growth on the affected side. However, in milder cases where these structures are present, growth of the affected side can parallel that of the contralateral side. It is postulated that variations in muscle activity and function may contribute to differences in growth. In contrast to congenitally acquired forms, mandibular asymmetry more commonly develops postnatally from a variety of potential causes, including inflammatory resorptive changes to the condyle, hyperplastic condylar growth, asymmetry of the cranial base, and trauma. Although the resulting pattern of mandibular growth in these conditions may resemble CFM, accurate diagnosis of the underlying etiology is essential to anticipate future growth changes.
In spite of many well-designed longitudinal studies, the progressive component of asymmetric growth in CFM remains controversial. The trajectory of future growth is central to surgical treatment planning strategies in deciding between early vs late intervention. Some studies have demonstrated progressive deformity with age, whereas others reported significant compensatory growth of the affected side. Generally, the degree of severity or type of asymmetric morphology has not been shown to correlate with the growth pattern of the maxilla or the mandible. Wide interindividual variability in growth patterns has been observed. This heterogeneity in clinical presentation and observed growth patterns in CFM presents a challenge to treatment planning. Consequently, approaches to treatment vary among clinicians. Some advocate early surgical intervention to enhance mandibular growth and reduce dysplastic compensatory growth. Others prefer to minimize early surgical intervention and perform definitive correction near the completion of growth. This viewpoint rests on evidence that shows significant growth of the affected side occurring in parallel with the contralateral side. Clearly. additional clinical data are necessary to resolve this uncertainty.
Treatment strategies to correct or intercept asymmetric jaw growth depend on understanding the patterns of growth in these conditions. In this study, we aimed to (1) characterize and quantify mandibular asymmetry in conditions of abnormal growth, specifically CFM and noncongenitally acquired mandibular asymmetry; (2) quantify and image mandibular growth and remodeling patterns in these groups; and (3) identify localized regions of asymmetric growth in the 3 groups.
Material and methods
Patients were selected for the 3 groups based on inclusion criteria related to their initial diagnosis. Because of the rarity of the syndrome, a retrospective case-control approach was used. The control patients (group A) were obtained from an unrelated retrospective study of consecutively treated orthodontic patients from a private practice clinic in Ann Arbor, Mich. They had Angle Class I occlusion and symmetric midlines, and they had received no orthopedic treatment. The use of cone-beam computed tomography (CBCT) images in this prior study was reviewed by the institutional review board at the University of Michigan. Patients in the control group were matched by age, sex, and cervical vertebral maturation (CVM) stage to the subjects in groups B and C ( Table I ). Group B consisted of patients with moderate to severe nonsyndromic dentofacial asymmetry from the orthodontic clinic at the University of Michigan or the University of California, San Francisco. Patients with inflammatory or degenerative changes to the condyle were excluded. Protocols were reviewed by the institutional review boards at the University of Michigan and the University of California (number HUM00078815). All patients in this group had a diagnosis of unilateral mandibular hyperplasia, based on radiographic and clinical findings over time. Only patients with a skeletal midline deviation of 3 mm or greater relative to the midsagittal reference plane were included. Time point T0 was obtained as part of the initial records for phase 1 or 2 orthodontic treatment before completion of mandibular growth. The second time point (T1) was selected from records taken just before orthognathic surgery.
| Patient | Diagnosis | T0 age (y) | T1 age (y) | Sex | CVM stage at T0 |
|---|---|---|---|---|---|
| Group A, symmetric controls | |||||
| A1 | 12.3 | 14.2 | F | III | |
| A2 | 10.7 | 12.4 | M | I | |
| A3 | 10.8 | 13.8 | F | II | |
| A4 | 12.2 | 14.8 | F | III | |
| A5 | 12.7 | 15.2 | F | III | |
| A6 | 12.9 | 14.9 | F | III | |
| A7 | 13.0 | 15.0 | F | II | |
| A8 | 14.8 | 17.0 | M | III | |
| A9 | 13.5 | 15.2 | M | II | |
| A10 | 12.3 | 14.2 | M | III | |
| Mean | 12.5 | 14.7 | |||
| Group B, dentofacial asymmetry | |||||
| B1 | Hyperplasia left side | 12.0 | 15.1 | F | II |
| B2 | Hyperplasia left side | 12.1 | 14.0 | F | II |
| B3 | Hyperplasia right side | 10.6 | 12.8 | M | I |
| B4 | Hyperplasia left side | 10.3 | 12.3 | F | II |
| B5 | Hyperplasia right side | 8.9 | 11.4 | F | II |
| B6 | Hyperplasia right side, prognathic | 16.8 | 20.3 | M | III |
| B7 | Hyperplasia left side, canting | 14.0 | 16.1 | M | III |
| B8 | Hyperplasia left side, canting | 9.8 | 13.2 | M | I |
| B9 | Hyperplasia left side | 11.6 | 13.3 | F | II |
| B10 | Hyperplasia right side, canting | 12.3 | 14.2 | F | III |
| Mean | 11.8 | 14.2 | |||
| Group C, CFM | |||||
| C1 | OAV spectrum disorder, type IIA right CFM | 11.8 | 13.8 | F | II |
| C2 | Type I left CFM | 8.0 | 8.6 | M | I |
| C3 | Type I left CFM | 9.3 | 10.8 | F | II |
| C4 | Type IIA left CFM | 16.3 | 20.0 | M | IV |
| C5 | Type IIA left OAV | 11.4 | 15.1 | M | I |
| C6 | Type IIA right Goldenhar’s syndrome | 8.3 | 8.9 | F | I |
| C7 | Type I left CFM | 16.4 | 17.2 | M | III |
| C8 | Type I left CFM | 13.7 | 15.4 | M | II |
| C9 | Type I right CFM | 16.6 | 19.9 | F | IV |
| Mean | 12.4 | 14.4 | |||
In group C, 9 patients with CFM or oculo-auriculo-vertebral (OAV) spectrum disorder were identified retrospectively from records in the craniofacial clinic at the University of California under medical search headings for hemifacial microsomia, Goldenhar’s syndrome, or OAV. In this group, patients who came to the orthodontic clinic within the last 9 years were identified from 2 CBCT images obtained before orthognathic surgery, with T0 at the initial records and T1 prior to surgery. The average time between T0 and T1 was 2.1 years, ranging from 6 to 40 months. Only patients with a Pruzansky-Kaban Class I or IIA mandible were included in this group. Because of the rarity of this syndrome, 9 subjects met the defined inclusion criteria. This patient sample is summarized in Table I , including the initial diagnosis and the specific skeletal growth stage (CVM) at the start of orthodontic treatment.
CBCT radiographs were taken using a 0.376-mm 3 voxel dimension with a 9-in spherical volume on a CBCT scanner (MercuRay; Hitachi, Tokyo, Japan). Segmentation of the mandibular images from the CBCT data was performed with free open-source software (ITK-SNAP; http://www.itksnap.org ). Edge-finding algorithms in this software were used for boundary detection so that arbitrary voxel-intensity thresholds were not required for segmentation.
The mandibular registration approach used in this study aimed only to find relative (right to left) differences in mandibular growth and remodeling over time. The mandibular time points were registered using an automated, voxel-wise approach that incorporated a reference region as a target. These steps essentially involve isolating a target region of the mandibular symphysis for registration using the voxel-wise approach described by Nguyen et al. This region is limited to the U-shaped portion of the symphysis mesial to the first molar, with the outer and inferior cortical borders and internal tooth buds removed. The mandibles are first closely approximated manually, followed by successive iterations of automated registrations on the target region until the 6 registration parameters (translation [components x, y, and z], roll, yaw, and pitch) converge. The CMF growing registration module in the free open-source software 3D Slicer (CMFreg extension module; www.slicer.org ) was used for automated registration. The method error was evaluated by repeating mandibular registrations and observations of growth; they showed a combined error of 1 mm or less using the Bland-Altman method. Previous human and animal model studies have also shown that the errors of 3-dimensional (3D) mandibular registrations range from 0.3 to 1.0 mm with similar conditions and voxel sizes.
Correspondence between points on the surfaces of the 3D models at the 2 time points was established using a spherical harmonic-based algorithm, whereby the shape of the mandibular surface was approximated with a spherical harmonic series. This analysis requires that the surfaces have spherical topology; therefore, the mandibular volume was divided into 2 halves at the midline so that a spherical coordinate system could be used in each. Second, the surface was filled so that it was smooth and continuous. The spherical harmonic analysis algorithm was then applied to determine shape-based correspondence between 2192 points over the hemimandibular surfaces.
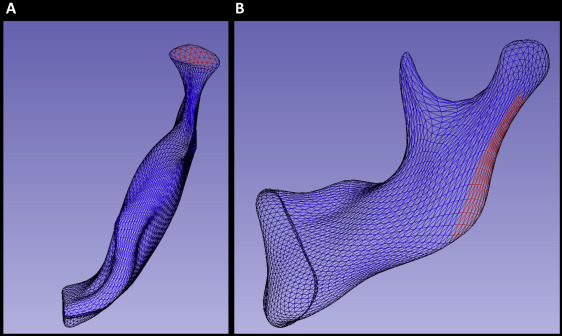
After subtracting the corresponding 3D surfaces distances, color-coded maps were used to identify the regions of greatest growth for each patient. These regions were then selected for regional measurement of growth ( Fig 1 ). The quantification method in this study followed a novel approach developed using the Pick ‘n Paint extension module in the 3DSlicer software ( www.slicer.org ). This approach enabled the propagation of regional surface points to corresponding regions of shape across all time points and patients. Two regions of mesh points were selected on an arbitrary reference left hemimandible at the superior surface of the condyle and the posterior surface of the ramus on each side ( Fig 1 ). A radius of surface mesh points was defined around a center, creating a specific region of shape on the surface. The radius was equal to 4 mesh points for the condylar region ( Fig 1 , A ) and 5 points for the posterior border of the ramus ( Fig 1 , B ). This region was then automatically propagated through the entire population of hemimandibles using shape correspondence mapping, so that the same anatomic region was compared within sides of the mandible and between subjects. As a result, the placement of arbitrary landmarks was not required for the measurement of regional growth. Distances between corresponding points on the T0 to T1 surfaces, consisting of 61 regional measurements at the condyle ( Fig 1 , A ) and 91 along the posterior border of the ramus ( Fig 1 , B ), were selected for statistical comparison in a linear mixed model.
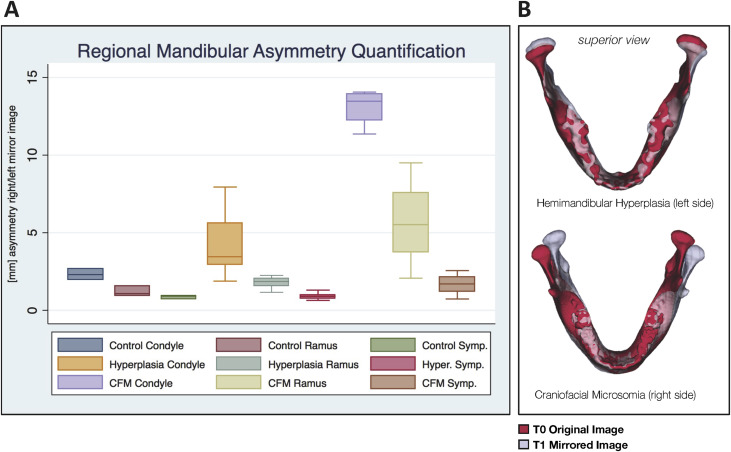
To characterize initial asymmetry at T0, all right hemimandibles were reflected to create a left mirror image. This enabled shape-based comparison of the right and left sides. Asymmetry between the right and left sides was compared by superimposing the mirrored image of the mandible on itself ( Fig 2 , B ) according to the method described by Alhadidi et al. To align these surfaces, the mirror image was first manually approximated to the original mandible. Then a final automated voxel-wise registration step was performed using the previously described target region. The 95th percentile displacement in selected regions of the condyle, ramus, and symphysis ( Fig 2 , A ) was chosen to represent regional asymmetry in each subject. These results were then compared across the samples at T0.
Statistical analysis
The 3 groups were tested for statistical differences in age and CVM stage using the Kruskal-Wallis test, a nonparametric analysis of variance (ANOVA). A post-hoc power analysis with information collected from the study participants estimated the power to be 84%. A linear mixed model was used to test for statistical differences in growth between sides and regions of the mandible in the 3 groups. The nature of the project necessitated that multiple growth measurements of the mandible be taken from each patient. An ordinary least squares or ANOVA model would be inappropriate in this case because of the violation of the independence assumption. A linear mixed model accommodates the observed nonindependence of observations and provides unbiased estimates of the effects of interest. Analogous to a repeated-measures ANOVA, a linear mixed model allows for the variations in mandibular growth measurements to be estimated at 2 levels, within subjects and between subjects. Beyond independence, linear mixed models share many of the same assumptions as those governing ordinary least squares, including the assumption of normally distributed residuals. The residuals estimated by the model were found to be approximately normally distributed. A software package (StataSE 13; StataCorp, College Station, Tex) was used for all statistical analyses.
Results
The populations in the 3 groups described in Table I were comparable in terms of initial age, treatment length, and CVM stage. No statistically significant difference was found in the age at T0 among groups A, B, and C ( P = 0.99). Similarly, no difference was seen at T1 among the groups ( P = 0.97). The median CVM stage, using the 5-stage system, was between II and III at T0 in all 3 groups. According to Baccetti et al, mandibular growth velocity peaks in less than 1 year after CVM stage II, indicating active mandibular growth during the measured time interval. No significant difference in CVM stage or sex was found among the groups ( P = 0.825 and P = 0.45, respectively).
The local left and right asymmetries in the anatomic regions of interest are shown in millimeters for each group in Figure 2 , A . Group A had the least initial asymmetry, with less than a 3-mm discrepancy in shape between the right and left sides. Asymmetry was greatest at the condyles. Group B was characterized by both greater overall asymmetry at the condyles and greater variability than group A ( P = 0.001). Group C was characterized by the greatest asymmetry ( P <0.001), with over 10 mm of shape discrepancy at the condyles and over 5 mm at the ramus. Superimposed overlays (representative subjects in Fig 2 , B ) showed primarily inferior and superior shape discrepancies at the condyles in the dentofacial asymmetry group, whereas the CFM group had primarily mediolateral deviations in the position of the ramus and inferosuperior deviations in the position of the condyle.
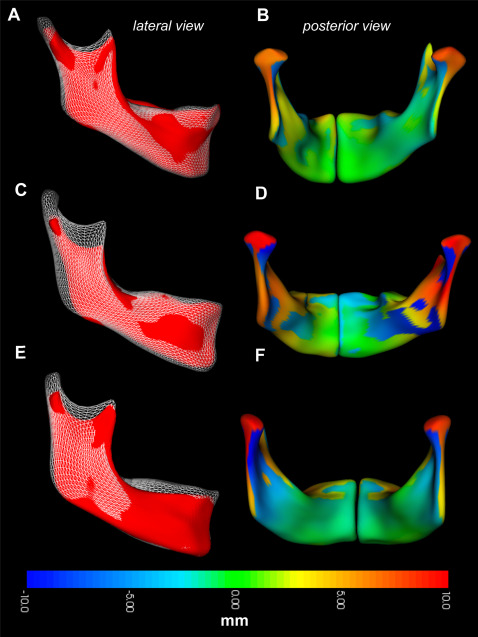
Regional measurements of mandibular growth in the control group are shown in Figure 3 , depicting both the direction ( Fig 3 , A ; white overlay ) and the magnitude ( Fig 3 , B ; colored surface ) of changes to the mandibular surface over time. In this group, the articulating surface of the condyle and the sigmoid notch showed the greatest appositions in a predominantly superior and posterior direction, with a slight lateral component. The directions varied in orientation between subjects, with some characterized by more vertical growth. The lingual surface of the condylar neck showed the greatest resorptive remodeling, with net resorption extending toward the lingula. The lingual surface of the gonial angle was also characterized by resorption. The resorptive pattern varied over the lingual surfaces between subjects, concentrated over the submandibular fossa. The lingual surface of the superior ramus and the posterior aspect of the mylohyoid ridge were characterized by apposition ( Fig 3 , D and F ; orange ). The posterior border of the ramus also showed appositional growth, which was concentrated at the gonial angle. This appositional region transitioned to resorptive toward the superior aspect of the posterior ramus. The dental arch was also characterized by active vertical growth, with a direction ranging from superior to anterosuperior. The anterior border of the symphysis showed variable and minor resorption. In some subjects ( Fig 3 , C ; white overlay ), significant apposition occurred at pogonion and the anterior portion of the inferior border.
Stay updated, free dental videos. Join our Telegram channel
VIDEdental - Online dental courses


