Imaging plays a role in the anatomic assessment of the airway and adjacent structures. This article discusses the use of 3-dimensional (3D) imaging (cone beam computed tomography [CBCT]) to evaluate the airway and selected regional anatomic variables that may contribute to obstructive sleep-disordered breathing (OSDB) in patients. CBCT technology uses a cone-shaped x-ray beam with a special image intensifier and a solid-state sensor or an amorphous silicon plate for capturing the image. Incorporation of 3D imaging into daily practice will allow practitioners to readily evaluate and screen patients for phenotypes associated with OSDB.
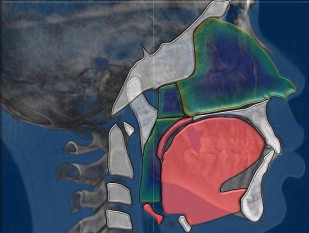
Imaging plays a role in the anatomic assessment of the airway and adjacent structures. Obstructive sleep-disordered breathing (OSDB) is not diagnosed with imaging, but imaging can identify patients with airways who are at risk for obstruction and other anatomic characteristics that may contribute to OSDB. The airway extending from the tip of the nose to the superior end of the trachea can be visualized on conventional computed tomography (CT) and cone beam CT (CBCT) scans. Because these scans also include the jaws, teeth, cranial base, spine, and facial soft tissues, there is an opportunity to evaluate the functional and developmental relationships between these structures. The skeletal support for airway is provided by the cranial base (superiorly), spine (posteriorly), nasal septum (anterosuperiorly), jaws, and hyoid bone (anteriorly). The airway valves include the soft palate, tongue, and epiglottis ( Fig. 1 ). Airway obstructions or encroachments are of interest because they increase airway resistance that may contribute to OSDB; therefore, visualization and calculation of the airway dimensions are important. Common airway encroachments include turbinates, adenoids, long soft palate, large tongue, and pharyngeal and lingual tonsils. Less common airway encroachments include polyps and tumors.
This article discusses the use of 3-dimensional (3D) imaging (CBCT) to evaluate the airway and selected regional anatomic variables that may contribute to OSDB. Optimal treatment outcomes begin with a complete and accurate diagnosis. Imaging may assist in delineating attributes that contribute to OSDB in patients who do not have a phenotype (such as high body mass index) that is routinely associated with OSDB.
CBCT and image analysis
Technological advances in computing power, sensor technology, and reconstruction algorithms have merged and resulted in the introduction of a CBCT (also known as volumetric imaging). Volumetric imaging is synonymous with 3D imaging because the information has depth in addition to height and width. The 3D imaging domain includes radiograph (CT and CBCT) and magnetic resonance imaging technologies. The 2 principal differences that distinguish CBCT from traditional CT are the type of imaging source-detector complex and the method of data acquisition. The radiograph source for CT is a high-photon, output rotating anode generator, whereas for CBCT it can be a low-energy fixed anode tube similar to that used in dental panoramic machines. CT uses a fan-shaped x-ray beam from its source to acquire images and records data on solid-state image detectors that are arranged in a 360° array around the patient. CBCT technology uses a cone-shaped x-ray beam with a special image intensifier and a solid-state sensor or an amorphous silicon plate for capturing the image.
Conventional medical CT devices image patients in a series of axial plane slices that are captured either as individual stacked slices or using a continuous spiral motion over the axial plane. Conversely, CBCT presently uses one rotation sweep of the patient similar to that used for panoramic radiography. Image data can be collected for either a complete dental/maxillofacial volume or a limited regional area of interest. Scan times for these vary from 8 to 40 seconds for the complete volume. CBCT has a significantly lower radiation burden than a comparable scan using a conventional CT. CBCT has a favorable risk/benefit ratio for many craniofacial applications, including imaging of the airway and associated craniofacial structures.
Anatomic accuracy
An ideal imaging goal is to accurately represent the anatomy as it exists in nature, that is, the anatomic truth. The projection geometry associated with 2D techniques does not produce accurate anatomic images. 3D digital techniques using back projection algorithms create the opportunity to produce anatomically accurate images.
Current 3D imaging techniques allow an anatomically accurate capture of the surface and subsurface structures. One measure of image quality is the ability to detect small anatomic features. The variables that have significant influence on the quality of a CBCT include voxel size (smallest element in a 3D digital image), dynamic range (number of gray levels), signal, and noise. In general, the best quality image is composed of small voxels, large number of gray levels, high signal, and low noise. CBCT voxels are isotropic (equal size in all dimensions x, y, and z) and range in size from 0.1 to 0.4 mm. The captured field of view (FOV) can be scaled to match the regions of interest (ROIs). The ROI can include the entire craniofacial region or a selected subsection of the craniofacial anatomy. The display of the captured FOV or subset of image data can be viewed from any angle using various display techniques ( Fig. 2 ). For example, the entire craniofacial skeleton may be captured using a CBCT scan, but using software tools, an ROI (such as the airway) may be selected, displayed, and analyzed. Several software companies have developed application-specific display and analysis software that result in the measurement (linear, area, volume, angular) of segmented and integrated anatomic structures. Of particular interest is the metric analysis of the airway and the adjacent structures. Specialized software for metric analysis of the airway has been calibrated using orthogonal and oblique airway phantoms, and has been validated for accuracy and precision. The convergence of CBCT with the application software is very beneficial in understanding and diagnosing OSDB and its relationship to craniofacial anatomy.

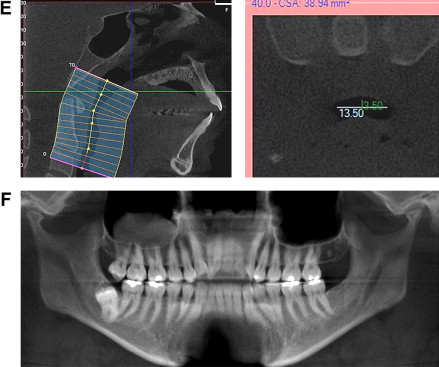
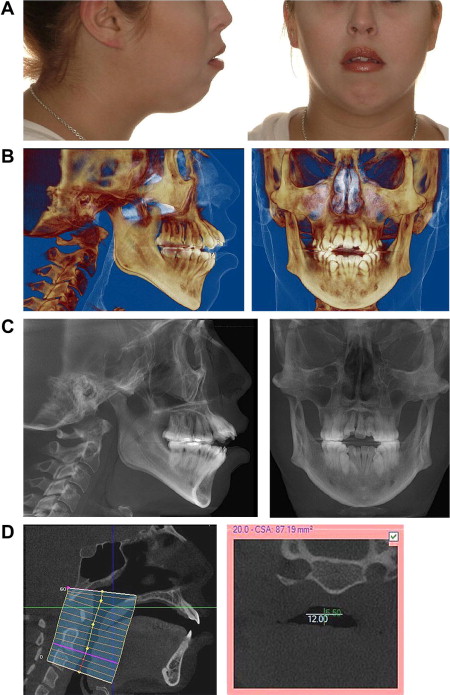
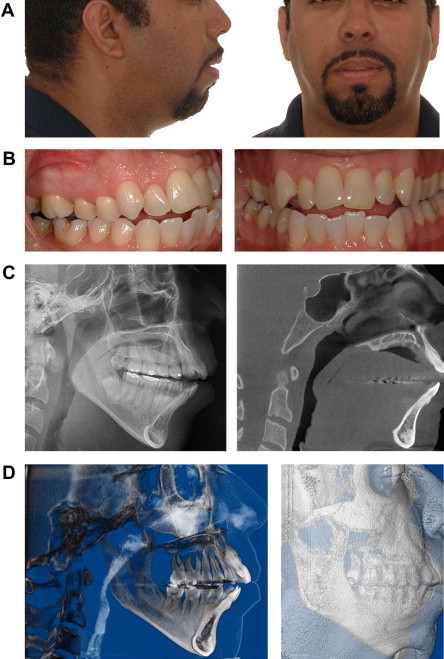
Facial growth and the airway
Alterations from the normal pattern of nasal respiration occurring during active growth can affect the development of the craniofacial skeleton in humans and experimental animals. Severely reduced nasal airflow may induce compensations that include an inferior mandibular rest position, parting of the lips, increased interocclusal space, lower or more forward tongue position, lower positioning of the hyoid bone, a modal shift from nasal breathing to mouth breathing, anterior extension of the head and neck, increased anterior face height, increase in the mandibular and occlusal plane angles, narrow alar base, narrow maxillary arch, high palatal vault, posterior crossbite, class II occlusion, and clockwise facial growth pattern. These compilations of craniofacial and occlusal traits produce a facial phenotype that has been cited in the orthodontic literature as “adenoidal facies,” thus ascribing an etiology and expressing a bias that hypertrophic adenoidal tissues are the cause of an obtunded nasal airflow that results in a specific pattern of craniofacial deformation. However, this facial phenotype may also occur secondary to aberrant mandibular growth. The end result in several craniofacial growth scenarios may be associated with alterations in airway dimensions, airway resistance, and functional airway patency, but the cause-and-effect relationships need to be considered. For example, does an anatomic reduction in airway function cause the craniofacial compensations or does abnormal craniofacial growth result in compromised airway function? The anteroposterior dimensions of the airway have been shown to have a proportional relationship to jaw growth and facial growth pattern. The airway is largest when there is normal mandibular and maxillary growth and when facial growth pattern occurs with a counter-clockwise rotation. Conversely, the airway is smaller with deficient maxillary and mandibular growth and when there is a clockwise facial growth pattern. Because mandibular growth has been linked to condylar growth and degenerative joint disease (DJD, also known as osteoarthritis) affects condylar growth, it is reasonable to postulate that a developmental onset of DJD may limit airway dimensions ( Figs. 3 and 4 ).