Introduction
The purposes of this study were to obtain information about mechanical properties with the nanoindentation test for representative wire alloys and compare the results with conventional mechanical tests.
Methods
Archwires having 0.016 × 0.022-in cross sections were obtained of 1 stainless steel, 1 cobalt-chromium-nickel, 1 beta-titanium alloy, and 2 nickel-titanium products. Specimens of as-received wires were subjected to nanoindentation testing along the external surfaces and over polished cross sections to obtain values of hardness and elastic modulus. Other specimens of as-received wires were subjected to Vickers hardness, 3-point bending, and tension tests. All testing was performed at 25°C.
Results
Differences were found in hardness and elastic modulus obtained with the nanoindentation test at the external and cross-sectioned surfaces and with the conventional mechanical-property tests. Mechanical properties obtained with the nanoindentation test generally varied with indentation depth.
Conclusions
The 3 testing methods did not yield identical values of hardness and elastic modulus, although the order among the 5 wire products was the same. Variations in results for the nanoindentation and conventional mechanical property tests can be attributed to the different material volumes sampled, different work-hardening levels, and an oxide layer on the wire surface.
Orthodontic wires, which generate the biomechanical forces communicated through brackets for tooth movement, are central to the practice of orthodontics. In the rational selection of wires for a particular treatment, an orthodontist should consider a variety of mechanical properties, such as elastic range or springback, elastic modulus, and yield strength. Currently, orthodontists principally use wires of 4 major base metal alloy types: stainless steel, cobalt-chromium-nickel, nickel-titanium, and beta-titanium, and a variety of bending and tension tests have been performed to determine elastic modulus and yield strength. In addition, the property of hardness has major importance in the comparison of dental materials, and microhardness testing has been used to characterize orthodontic wires. Hardness is influenced by the microstructure and is expected to be related to the yield strength for orthodontic wires of the same alloy type.
Recent advances in the nanoindentation test have allowed the measurement of mechanical properties for extremely small volumes of materials where the contact radius is less than 100 nm. In nanoindentation testing, the load and displacement are recorded with a high-resolution displacement gauge during the indentation process, and the area of the indentation is obtained from the geometric form of the indenter without having to actually observe the indentation; thereby, the hardness of the specimen can be calculated. In addition, the elastic modulus for this small volume of material can be obtained mathematically from the load-displacement curve by using suitable software. A recent study used the nanoindentation test to investigate the effects of decontamination and clinical exposure on the elastic modulus, hardness, and surface roughness of 2 frequently used orthodontic wires. However, little is known about the relationship between the mechanical properties (hardness and elastic modulus) obtained by the nanoindentation test and the conventional mechanical tests.
The purposes of this study were to use the nanoindentation test to examine commercial orthodontic wires and to compare the mechanical properties (hardness and elastic modulus) with values of hardness and elastic modulus obtained by the conventional Vickers hardness test, 3-point bending test, and tension test.
Material and methods
Five wire products—2 nickel-titanium, 1 beta-titanium, 1 stainless steel, and 1 cobalt-chromium-nickel, with cross-section dimensions of 0.016 × 0.022-in—were obtained from 4 manufacturers ( Table I ). The as-received wires were cut into 25-mm segments with a slow-speed, water-cooled diamond saw (Isomet 11-1280; Buehler, Lake Bluff, Ill) for nanoindentation, Vickers hardness measurements, and 3-point bending tests. All wires were obtained as preformed arches. The wires for tension testing were sectioned at the midline, and the most straight portions were used. The Elgiloy Blue wires (Rocky Mountain Orthodontics, Denver, Colo) were heat treated as suggested by the manufacturer by using an electrical resistance welding apparatus (SS-100; Sankin, Tokyo, Japan) before mechanical testing.
| Product | Manufacturer | Lot | Alloy type |
|---|---|---|---|
| Copper Ni-Ti (A f 35°C) | Ormco, Orange Calif | 02C194C | Nickel-titanium-copper |
| Nitinol Classic | 3M Unitek, Monrovia, Calif | 376 | Nickel-titanium |
| Resolve | Dentsply GAC International, Bohemia, NY | F0712092 | Beta-titanium |
| Unitek Stainless Steel | 3M Unitek, Monrovia, Calif | 507 | Austenitic stainless steel |
| Elgiloy Blue | Rocky Mountain Orthodontics, Denver, Colo | 040308 | Cobalt-chromium-nickel |
The as-received wires were fixed on the specimen stage with adhesive resin (Superbond Orthomite; Sun Medical, Shiga, Japan) for the nanoindentation test on the external surface. For nanoindentation testing of the cross sections, as-received wires were encapsulated in epoxy resin (Epofix; Struers, Copenhagen, Denmark), and the specimens were ground (600-grit sandpaper) and then polished by using a series of silicon-carbide abrasive papers and a final slurry of 0.05-μm alumina particles. All nanoindentation testing (ENT-1100a; Elionix, Tokyo, Japan) was carried out at 25°C by using a Berkovich indenter. Each test consisted of 3 segments: 10 seconds for loading to the peak value, 1 second holding at the peak load, and 10 seconds for unloading. Four peak loads of 2, 20, 50, and 100 mN were used for the measurements on the external surfaces, and only the 100-mN peak load was used for measurement on the cross-section surface. The hardness (H IT ) and elastic modulus (E IT ) were calculated by software available with the nanoindentation apparatus. Figure 1 shows a schematic representation of the loading-unloading curve obtained by the nanoindentation testing. Linear extrapolation methods (ISO standard 14577) were used for the unloading curve between 95% and 70% of the maximum test force to calculate the elastic modulus ( Fig 1 ), and this method assumes that the first portion of the unloading curve is linear and extrapolates that linear portion to intersect the displacement axis. Load-frame compliance and tip-shape calibration were performed by using the method of Sawa and Tanaka with fused quartz.
Vickers hardness measurements were performed at 25°C with a 2.94 N (300 gf) load and a 30-second dwell time for all specimens (MVK-F; Akashi, Tokyo, Japan). Ten indentations were made for each as-received wire product. The resulting values of Vickers hardness were then converted for comparison with the corresponding values from the nanoindentation test by using the following formula given in the ISO standard : HV (Vickers hardness) = 0.0924 H IT (hardness obtained by the nanoindentation test).
A 3-point bending test was carried out for the as-received wire products (n = 10). The span length between supports for the test specimens was 12 mm, which was chosen in accordance with ANSI/ADA specification no. 32. Specimens were loaded at 25°C to a deflection of 3 mm, by using a rate of 0.5 mm per minute with a universal testing machine (EZ Test; Shimadzu, Kyoto, Japan).
Tension tests for the as-received wire products were conducted with another universal testing machine (AG-X, Shimadzu) by using a 1-kN load cell (n = 5). A pair of grips with grooves was used for holding the wire specimens of approximately 30-mm gauge length, and the tension tests were carried out at a crosshead speed of 1 mm per minute. A video noncontact extensometer (DVE-201, Shimadzu) was used to measure the tensile elongation of the wires.
Statistical analysis
The data obtained from the 3-point bending and tension tests were analyzed with Trapezium 2 software (Shimadzu) to calculate the elastic modulus and 0.1% yield strength. Statistical comparisons were performed with the Statistical Package for Social Sciences software for Windows (version 16.0J; SPSS, Chicago, Ill). Because the data were not normally distributed, values of elastic modulus obtained with the 4 methods (3-point bending, tension, nanoindentation on external surface, and nanoindentation on cross section of wire) were compared by using the Kruskal-Wallis test. The Mann-Whitney U test was then used for 2 independent groups, and the Bonferroni adjustment was applied. Values of yield strength obtained by the 3-point bending and tension tests were compared with the Mann-Whitney U test. Similarly, values of Vickers hardness and values of hardness obtained with the nanoindentation test for the external surfaces and the cross sections with the 100-mN load were compared by using the Kruskal-Wallis and Mann-Whitney U tests.
Results
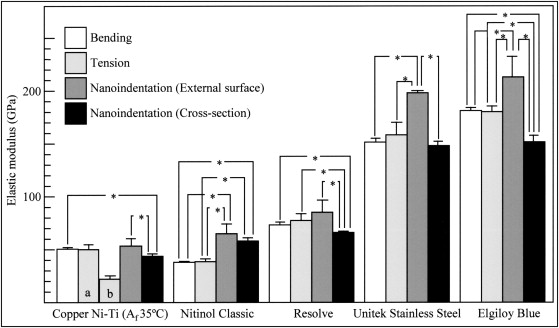
Mean values and standard deviations for the elastic modulus obtained with the 3-point bending, tension, and nanoindentation tests on the external and cross-section surfaces (100-mN peak load) are shown in Figure 2 . The 35°C Copper Ni-Ti wire (Ormco, Orange, Calif), with an austenite-finish temperature A f of 35°C, was excluded in the statistical comparisons of elastic modulus because the elastic deformation region of the tension test contained linear regions with 2 different slopes corresponding to the austenitic and martensitic phases. From the Kruskal-Wallis and Mann-Whitney U tests, the mean values of elastic modulus obtained by nanoindentation of the external surface for the Nitinol Classic, Unitek Stainless Steel (both 3M Unitek, Monrovia, Calif), and Elgiloy Blue wires were significantly higher than those obtained by the conventional 3-point bending and tension tests. With the nanoindentation test and for all types of the wires except Nitinol Classic, the mean elastic modulus for the external surface was significantly higher than for the cross-section surface. The mean elastic modulus values obtained by nanoindentation of the cross-section surface for the Resolve (Dentsply GAC International, Bohemia, NY) and Elgiloy Blue wires were significantly lower than the mean values obtained with the bending and tension tests, although the mean elastic modulus obtained from nanoindentation of the cross-section surface for the Nitinol Classic was significantly higher than values obtained from the bending and tension tests. Although the different testing methods did not show identical results for elastic modulus, the order of the 5 products was the same.
Stay updated, free dental videos. Join our Telegram channel
VIDEdental - Online dental courses


