Introduction
The purposes of this study were to examine the amounts of overjet in the anterior and posterior segments of 3 arch forms by using facial axis points on 3-dimensional virtual models and to verify the minimum posterior extension required for classification of the arch form in normal occlusions.
Methods
Facial axis points were digitized on 97 virtual models with normal occlusion, classified into 20 tapered, 25 ovoid, and 52 square arch forms. Intercanine and intermolar arch widths and depths were measured. The best-fitting curves were created, and overjet was measured at each facial axis point. Two-way analysis of variance (ANOVA) was performed to assess the relationship between arch form and overjet in different areas. The minimum posterior extension to determine arch type was analyzed with the chi-square test.
Results
Subjects with a tapered arch form had larger overjet compared with those with ovoid and square forms, except at the central incisor. A significant difference in overjet among different areas was found in subjects with a square arch form ( P <0.0001). No significant difference ( P = 0.864) was found among the first and second premolar and the first molar groups for classifying arch-form types.
Conclusions
A significant difference was found in anterior and posterior overjet according to arch types. The extension to the first premolar was sufficient to classify arch form type. It might be beneficial to consider more coordinated preformed superelastic archwires according to variations in overjet of different arch types.
The preservation of intercanine width is an indispensable part of treatment planning to reduce the risk of postretention relapse. In addition, improper occlusal relationships of teeth from morphologic variations were reported to cause recurrent crowding in the mandibular anterior region. Deviation from the normal transverse relationship might lead to root and alveolar bone resorption, tipping of teeth, periodontal damage, and esthetically compromised results. Consequently, proper arch coordination is 1 key element to obtain stable and functional treatment results.
Recently, new interactive treatment planning systems such as Suresmile (OraMetrix, Richardson, Tex), Incognito (Lingualcare, 3M Unitek, Dallas, Tex), and Insignia (Ormco, Orange, Calif) have offered better maxillary and mandibular arch coordination by individualizing archwires and brackets, resulting in shorter treatment times and more desired results.
Many authors have analyzed arch-form dimensions and anterior overjet alone using 2-dimensional techniques involving photocopies. However, these reports used various landmarks that could not represent the correct clinical bracket position. With the recent development of 3-dimensional (3D) virtual technology, most arch-form parameters can now be measured on the 3D virtual models as reliably and accurately as on the plaster models.
Kook et al compared overjet measured from the facial axis (FA) points to that measured from the bracket slot points to provide a guideline for arch coordination. Several authors have categorized arch forms into tapered, ovoid, and square shapes to evaluate their characteristics. However, they limited their evaluations to the mandibular models only; therefore, they could not analyze overjet. Interestingly, these investigations included only up to the first premolars in their arch-form classification methods, even though no study has yet conclusively determined whether it is necessary to include the second premolars and the first molars when classifying arch-form types. Also, the relationship between overjet and arch-form type has not been sufficiently evaluated in the literature.
Therefore, the purposes of this study were (1) to examine the amount of overjet in the anterior and posterior segments among 3 arch forms by using FA points on 3D virtual models and (2) to verify the minimum posterior extension required for classification of the arch form in a sample with normal occlusion.
Material and methods
The sample consisted of 97 young Korean adults with normal occlusion (58 men, 39 women). The subjects’ ages ranged from 20 to 25 years, with a mean of 23.3 years. The inclusion criteria were as follows: (1) Angle Class I molar and canine relationships; (2) 0° <ANB <4°; (3) normal overbite and overjet (>0 mm, <4 mm); (4) minimum arch-length discrepancy (<3 mm of crowding, <1 mm of spacing); (5) flat or slight curve of Spee (<2 mm); (6) no deviation in the dental midline or buccal crossbite; (6) permanent dentition with normal tooth sizes and shapes, except for the third molars; (7) no previous orthodontic treatment; and (8) no restorations extending to contact areas, cusp tips, incisal edges, or facial surfaces.
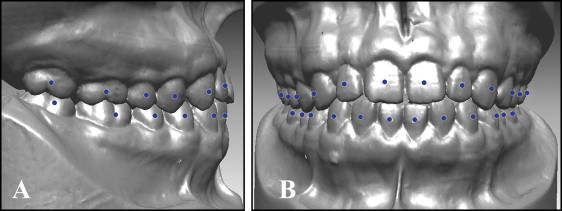
The amount of overjet was examined in the 3 arch types. The mandibular and maxillary casts were placed in the maximum intercuspation relationship and scanned with a 3D laser scanner (KOD-300, Orapix, Seoul, Korea) at 20-μm resolution. The FA points were digitized on each tooth of the virtual models by using Rapidform 2006 software (INUS Technology, Seoul, Korea) by 1 investigator (M.B.) with experience in the 3D technology ( Fig 1 ).
The transverse direction was set as the x-axis, the anteroposterior direction as the y-axis, and the line perpendicular to the x and y planes as the z-axis. The FA point on the maxillary right second molar was set as the origin of the x- and y-axes, and the z-axis values were nullified.
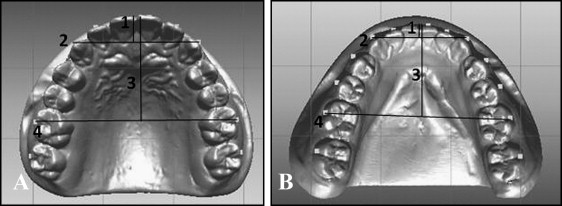
Four linear and 2 ratio variables were measured and calculated for each arch form ( Table I , Fig 2 ).
| Variable | Definition |
|---|---|
| Intercanine width (mm) | Distance between the FA points of the right and left canines |
| Intermolar width (mm) | Distance between the FA points of the right and left first molars |
| Intercanine depth (mm) | The shortest distance from a line connecting the FA points of the right and left canines to the midpoint between the FA points of the right and left central incisors |
| Intermolar depth (mm) | The shortest distance from a line connecting the FA points of the right and left first molars to the midpoint between the FA points of the 2 central incisors |
| Canine W/D ratio | Ratio between intercanine width and depth |
| Molar W/D ratio | Ratio between intermolar width and depth |
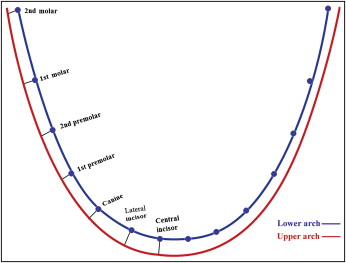
The amount of overjet at the anterior and posterior segments in each arch form was measured as follows. The x and y coordinates for the FA points of each case were entered into mathematical software (MATLAB 7.5 [R2007b], MathWorks, Natick, Mass) to draw the best-fitting curve that represented the arch. Because the polynomial function has been reported to be one of the best mathematical representations of the dental arch, several polynomial functions were applied, and the fourth degree (f [x] = ax 4 + bx 3 + cx 2 + dx + e) was selected, since it most accurately represented the arch form and produced the smoothest curves with no wave-like properties. Overjet was measured as the shortest distance from each FA point on the mandibular arch to the maxillary one ( Fig 3 ).
The measurements were made by 1 operator (M.B.) to eliminate interoperator variability. Ten cases were randomly selected and reassessed 2 weeks later by the same operator to evaluate intraoperator variability. The intraclass correlation test showed high reliability between the 2 assessments (>0.8).
The best-fitting curve of each mandibular cast was matched to arch-form templates by superimposing clear templates (OrthoForm, 3M Unitek, Monrovia, Calif) at the center of the curvature of the best-fitting curve. The sample was classified into 3 groups of 20 tapered, 25 ovoid, and 52 square arch forms.
Thirty randomly selected best-fitting curves were rematched with the OrthoForm template by the same operator. The difference between the 2 evaluations was analyzed by the Wilcoxon signed rank test and was negligible ( P >0.05).
Since there was no significant association between sex and arch form ( P = 0.153) when assessed by the chi-square test, male and female data were combined. Analysis of variance (ANOVA) was applied to compare the arch dimensions among the 3 arch-form types.
A t test was performed to evaluate the difference in overjet between the right and left sides; since there were no statistically significant differences, the data from both sides were combined. Two-way ANOVA was performed to assess the effect of arch form and tooth area on overjet. Since the results showed a significant intersection, 1-way ANOVA tests were performed for each variable independently, followed by the Scheffé post-hoc test to evaluate the homogeneous subgroups.
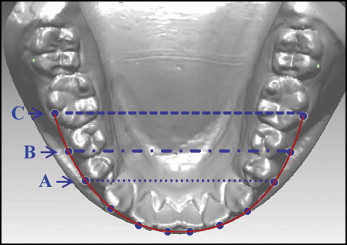
The effect of including the first and second premolars and the first molar on determining arch type was verified. Images of 2 tapered, 2 ovoid, and 2 square mandibular arch forms were randomly selected from our sample. These images were copied and placed in 3 groups. The arches in the first group were cropped at the points that represent the first molar; in the second group, at the second premolar; and in the third group, at the first premolar ( Fig 4 ).
The images were shuffled and presented to a panel of 30 orthodontists, who were asked to match the arch forms to the OrthoForm templates using the same matching method as in this study. Thus, each orthodontist matched 18 arch forms, and their matching pattern was evaluated by assigning a score of 1 to the correct match and a score of 0 to the incorrect match. Then the scores were analyzed with chi-square tests to compare the correctness among the 3 groups.
Results
In comparing the correctness of matching the arch forms to the templates, the chi-square test showed no significant differences among the first premolar, second premolar, and first molar groups ( P = 0.864). On the other hand, it showed a significant difference among the arch types ( P <0.001). The percentage of correct matches was 90.2% ( Table II ). The most common mismatch in typing arch forms was failure to differentiate between the square and ovoid types; 33 of 53 incorrect matches were of this type.
| Extension | Arch type | P value for arch-type comparison | |||
|---|---|---|---|---|---|
| Tapered | Ovoid | Square | Total | ||
| First premolar | 95.0 | 91.7 | 86.7 | 91.1 | |
| Second premolar | 93.3 | 93.3 | 83.3 | 90.0 | |
| First molar | 98.3 | 90.0 | 80.0 | 89.4 | |
| Total | 95.6 | 91.7 | 83.3 | 90.2 | <0.001 ∗ |
| P value for extension comparison | 0.864 | ||||
Table III shows significant differences among the 3 arch forms for all arch-dimension variables, except for maxillary and mandibular intermolar depths. In the maxilla, the square arch form had a significantly greater intercanine width ( P = 0.006) and a smaller intercanine depth ( P = 0.024) than the tapered one. It also had a significantly greater intermolar width than both the tapered and ovoid arch forms ( P <0.0001 and P = 0.001, respectively). In the mandible, the tapered arch form had a significantly greater intercanine depth than the ovoid one, which was in turn greater than that of the square arch form. As in the maxilla, the mandibular square arch form had a significantly greater intercanine width than the tapered one, and a significantly greater intermolar width than both the tapered and ovoid arch forms ( P <0.0001 and P = 0.003, respectively).
| Variable | Maxilla | P value | Multiple comparison |
Mandible | P value | Multiple comparison |
||||||||||
|---|---|---|---|---|---|---|---|---|---|---|---|---|---|---|---|---|
| Tapered | Ovoid | Square | Tapered | Ovoid | Square | |||||||||||
| Mean | SD | Mean | SD | Mean | SD | Mean | SD | Mean | SD | Mean | SD | |||||
| Intercanine width (mm) | 37.21 | 1.44 | 37.89 | 1.41 | 38.68 | 1.90 | 0.004 † | S >T | 28.53 | 1.18 | 29.30 | 1.43 | 29.63 | 1.57 | 0.020 ∗ | S >T |
| Intermolar width (mm) | 56.59 | 2.18 | 57.49 | 2.29 | 59.85 | 2.75 | <0.001 ‡ | S >T and O | 51.50 | 1.99 | 52.89 | 2.24 | 54.82 | 2.35 | <0.001 ‡ | S >T and O |
| Intercanine depth (mm) | 9.02 | 0.81 | 8.45 | 1.03 | 8.36 | 0.85 | 0.022 ∗ | T >S | 5.94 | 0.83 | 5.09 | 0.68 | 4.46 | 0.71 | <0.001 ‡ | T >O >S |
| Intermolar depth (mm) | 30.17 | 1.81 | 29.28 | 1.88 | 29.90 | 1.58 | 0.185 | 26.86 | 1.53 | 25.69 | 1.76 | 25.90 | 1.71 | 0.052 | ||
| Canine W/D ratio | 4.15 | 0.30 | 4.53 | 0.46 | 4.66 | 0.41 | <0.001 ‡ | T <O and S | 4.88 | 0.61 | 5.85 | 0.71 | 6.81 | 1.09 | <0.001 ‡ | S >O >T |
| Molar W/D ratio | 1.88 | 0.13 | 1.97 | 0.13 | 2.01 | 0.11 | 0.001 † | S >T | 1.92 | 0.13 | 2.07 | 0.15 | 2.12 | 0.13 | <0.001 ‡ | T <O and S |
Stay updated, free dental videos. Join our Telegram channel
VIDEdental - Online dental courses


