Introduction
Previous studies have indicated that orthodontic-grade cone-beam computed tomography (CBCT) images are limited when displaying small defects at the mandibular condyles for diagnosis. In this study, we investigated whether this limitation was inherent to CBCT by comparing CBCT with multislice computed tomography (CT), and whether image segmentation and color mapping could overcome this limitation.
Methods
Nine fresh pig heads (18 condyles, 36 medial and lateral condylar regions) were used. Small osseous defects (diameter and depth, 1.5 mm) were created at the medial and lateral regions of the condyles shown by gutta percha markers. After the overlying soft tissues were restored, the pig heads underwent orthodontic-grade CBCT scans (0.4-mm voxel size; i-CAT; Imaging Sciences International, Hatfield, Pa) and medical-grade CT scans (0.625-mm voxel size; LightSpeed; GE, Little Chalfont, Buckinghamshire, United Kingdom). Subsequently, 2 calibrated and blinded raters diagnosed the defect numbers in each condylar region from CBCT and CT images using Dolphin 3D software (Patterson Supply, St Paul, Minn) without image segmentation, and then 1 week later with the proprietary image segmentation and color mapping tools of Dolphin 3D. Condylar polyvinyl siloxane impressions were collected and evaluated by the same raters to obtain physical diagnoses. Rediagnoses were made on randomly selected subsamples to assess reliability. Using the physical diagnoses as references, the accuracy of imaging diagnosis was assessed and statistically compared among the varied imaging and analysis methods.
Results
Image diagnoses of all imaging and analysis methods showed good or excellent intrarater and interrater reliability values, except for those of the segmented CBCT images, which were substantially lower. The numbers of overdiagnoses and underdiagnoses per condylar region were not significantly different among the varied imaging and analysis methods (Wilcoxon tests, P >0.05), but classification functions demonstrated substantially lower sensitivity and accuracy with CBCT than with CT. Logistic regression also showed that CT had a significantly higher probability (odds ratio, 2.4) than CBCT in reaching the correct diagnosis, whereas use of the image segmentation and color mapping tool proprietary to Dolphin 3D did not improve the diagnostic accuracy from CBCT images.
Conclusions
Even at a lower voxel size than medical CT images, orthodontic-grade CBCT images of mandibular condyles may be inherently less reliable and less accurate for the diagnosis of small condylar defects.
Highlights
- •
Large voxel size cone-beam computed tomography (CBCT) images are inferior to computed tomography images for diagnosing small condylar defects.
- •
Segmentation and color mapping of CBCT images did not improve diagnostic accuracy.
- •
Orthodontic-grade CBCT images are inadequate for screening small condylar defects.
Evaluation of temporomandibular joint (TMJ) structure and function is an important component of orthodontic diagnosis and treatment planning. Overall, the prevalence of temporomandibular dysfunction in orthodontic patients does not differ significantly from that in the general population, which has been reported by several studies to be in a range of 30% to 70%. For decades, mainly 2-dimensional (2D) imaging tools such as panoramic radiographs, cranial projections, and tomograms have been used to assess osseous structures of the TMJ; they showed that osseous changes can occur in 14% to 44% of patients with temporomandibular disorder symptoms or signs. These tools, however, are inherently limited in displaying the contours of the condyle and articular fossa, thus making diagnoses of pathologies such as osteophytes and erosions difficult and unreliable. Compared with 2D imaging tools, multislice computed tomography (CT) of the TMJ has significantly improved image quality to accurately display osseous changes of the TMJ affected by pathologies. Although representing a significant advance in TMJ imaging, CT is not suitable for common use in orthodontics because of the high radiation dose and financial burden associated with it. As an alternative 3-dimensional (3D) imaging tool, cone-beam CT (CBCT) has become increasingly popular in orthodontics in recent years. In addition to displaying the structures needed for routine orthodontic diagnosis and treatment planning, full field-of-view (FOV) CBCT images, which often also include the TMJ, make it possible to evaluate TMJ skeletal components without additional radiographs. The accuracy and reliability of CBCT for diagnosing osseous pathologies of the TMJ, however, greatly depends on the size of the pathology, the settings of the scan, and even the machine used. More specifically, whereas large osseous abnormalities can be accurately displayed and diagnosed by CBCT, small erosive defects, which may indicate early-stage osseous changes, are significantly more difficult to diagnose. This is especially the case when large FOV or large voxel-size CBCT scans are used. Patel et al further demonstrated that for CBCT images of common scan settings (0.4-mm voxel size, full-size FOV), a third of defects smaller than 2 mm can be overlooked.
These findings raise 2 questions. One was whether the difficulty involved in diagnosing small condylar osseous defects was a problem inherent to a relatively large voxel size or to the CBCT visual diagnostic technique. If it were the former, multislice CT images scanned with similar voxel sizes would show the same level of inaccuracy as orthodontic-grade CBCT images in detecting small condylar defects (<2 mm). A number of recent studies have compared CBCT with CT and found that these imaging tools had a similar ability in diagnosing condylar defects. However, these previous studies have either omitted the soft tissue factor or focused on relatively large defects (5-10 mm). Thus, whether small defects can be detected with the same reliability and accuracy between CBCT and CT has yet to be investigated. The other question is whether the inaccuracy involved in diagnosing small condylar defects from CBCT images can be improved by changing the analysis methods, such as using image segmentation based on gray levels and visual enhancement through color mapping. These tools are often provided by image-analysis software programs, and image segmentation has also been used before by others to assess condylar morphologic changes and resorption. Answers to these questions are important for making clinical decisions regarding the choices of radiographic tools for certain orthodontic patients. An example scenario is when a new patient comes for orthodontic treatment and reports frequent pain in the TMJ area. Should the practitioner prescribe a single large-FOV, large-voxel-size CBCT for both orthodontic treatment planning and diagnosis of the TMJ? Or should conventional 2D radiographs be prescribed for orthodontic treatment planning, and should small-FOV, small-voxel-size CBCT, or even CT be prescribed for diagnosis of the TMJ?
Therefore, the purpose of this study was to address these 2 main questions. Based on findings from previous studies on large condylar defects, we hypothesized that (1) the diagnostic ability of detecting condylar osseous defects would not be statistically different between orthodontic-grade CBCT images and medical-grade CT images scanned with clinically large FOVs and voxel sizes, and (2) the diagnostic ability of condylar osseous defects from CBCT images would be improved by using global segmentation and color mapping.
Material and methods
Nine cadaver heads from 4- to 6-month-old pigs were used in this study; they were collected from the Ohio State University Laboratory Animal Resources immediately after the animals were killed. Each condyle was dissected to expose the condylar head with care to preserve the soft tissue attachment. Then the condyles were demarcated into medial and lateral regions by small gutta percha pieces that were glued to the medial, lateral, and posterior sections of the condyle. Overall, 36 medial and lateral condylar regions were created. Before defect creation, the mandibular condyles were examined for existing defects. If any defects were found, the condyle was discarded and a replacement condyle was used. After confirming the intactness of the condyle, an operator (Z.S.) created small osseous defects in each medial or lateral region using a dental handpiece (NSK, Volvere Vmax; Brasseler USA, Savannah, Ga) with an end-cutting, 1.5-mm round bur. The drilling was stopped immediately after the bur was completely submerged into the bone, creating round defects of approximately 1.5 mm in diameter and depth. The number of defects in each region of each animal was predetermined using a random table and printed on a chart for defect creation.
Once the defects were created and the soft tissues were repositioned, each specimen underwent 2 scans: an orthodontic-grade CBCT scan (120 kV, 5 mA; i-CAT; Imaging Sciences International, Hatfield, Pa) at a clinically typical 0.4-mm voxel size and a medical-grade CT scan (LightSpeed 8-multidetector helical CT scanner; GE, Little Chalfont, Buckinghamshire, United Kingdom) at a clinically typical 0.625-mm voxel size. Once the scans were obtained, the soft tissues were completely removed from the condyles, which were subsequently sectioned from the posterior ramus. Light-bodied polyvinyl siloxane (PVS) impressions were made of each condylar head, with care to include the gutta percha markers for region identification.
Two orthodontic residents (E.M.J., M.P.) who were blinded to defect location and number in each condylar region independently analyzed the CBCT and CT scans. Before the analysis, both raters received training on reading CBCT and CT images from an investigator (Z.S.) with years of experience in studying CBCT imaging. The raters’ competency in processing the CT and CBCT images and detecting condylar defects was then confirmed by analyzing 4 randomly selected condyles. Dolphin 3D software (Patterson Supply, St Paul, Minn), a program most commonly used in clinical orthodontics, was chosen in this study. The analysis process included 2 steps, image reorientation for condylar region demarcation followed by defect detection. First, the CBCT or CT images were reoriented according to the positions of the gutta percha markers. Specifically, as illustrated by the CBCT images ( Fig 1 ), first in the coronal view, the condyle was rotated to show all 3 gutta percha markers in the same image and then further rotated to allow the horizontal line to pass through the medial and lateral markers and the perpendicular vertical line to pass through the posterior marker ( Fig 1 , A ). The medial and lateral condylar regions were divided by the vertical line. Next, after image reorientation, the raters evaluated each slice (0.5 mm thickness) in all 3 views ( Fig 1 , A-C ) for the presence or absence of defects from the mandibular ramus to the superior aspect of the condyle. When a defect was found, the raters determined the region (medial or lateral) where it was located. To prevent changes of region demarcation as stated above, no image rotation was allowed during the defect detection step. The total number of defects in each condyle region was recorded.
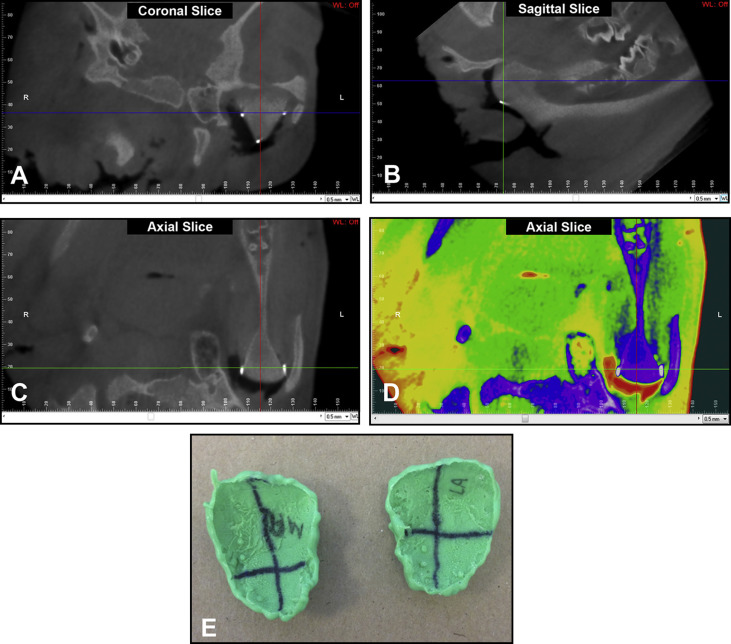
To test whether global segmentation and color mapping improve diagnostic ability, 1 week after the CBCT and CT scans were analyzed, the same 2 independent, blinded, and calibrated raters analyzed each scan with the help of proprietary image segmentation designed by Dolphin 3D ( Fig 1 , D ). The image orientation protocol was the same as that used for the nonsegmentation method described above ( Fig 1 , A-C ). The raters viewed all slices (0.5-mm thickness) in all 3 views and found defects in each condylar region.
To test intrarater reliability, 4 weeks after the initial image evaluations by both raters, 8 image sets were randomly selected for repeated evaluations according to the same protocols described above.
Finally, the same 2 raters analyzed the PVS impressions ( Fig 1 , E ), on which the medial and lateral regions were delineated similarly to those of the CBCT or CT images and labeled them with an indelible marker. The number of defects in each region was counted and recorded, serving as the references for assessment of image diagnoses. To control the impact of any experimental errors during the defect creation process—eg, creating an incomplete defect or creating defects in the wrong region—the PVS impressions were used for physical diagnosis instead of the planning chart with defect assignment. Furthermore, the PVS impressions were better for long-term storage and repeated diagnoses.
Statistical analysis
Interrater and intrarater reliability values of the CBCT and CT images were assessed by kappa tests.
The diagnostic accuracy of the CBCT and CT images was analyzed statistically in 2 ways. First, the CBCT and CT diagnoses were compared with physical diagnoses from the PVS impressions to determine overdiagnosis (more defects from radiographic images than from impressions) or underdiagnosis (fewer defects from radiographic images than from impressions) for each condylar region. These values were subsequently compared between different imaging methods (CBCT vs CT, nonsegmented CBCT vs segmented CBCT) using Wilcoxon matched-pairs signed ranks tests. The step-down Bonferroni method of Holm was used for adjustment of the P values because of multiple comparisons. Next, the numbers of true and false positive or true and false negative diagnoses of all condylar regions were pooled for calculating the overall classification functions including sensitivity, specificity, and accuracy to qualitatively demonstrate possible differences among the imaging and analysis methods. This accuracy parameter was defined as the total number of true defect diagnoses (including both positive and negative counts) divided by the total number of defect diagnoses. Subsequently, to statistically confirm the differences in relative ability of achieving accurate diagnoses among varied imaging and analysis methods (nonsegmented CBCT, nonsegmented CT images, and segmented CBCT images), a repeated-measures logistic regression analysis was conducted.
Results
The interrater reliability (kappa) for all images and analysis methods was equal to or above 0.75, except for that of the segmented CBCT images, which were near 0.6 ( Table I ). The intrarater reliability had the same trend for both raters, all showing high kappa values, except for segmented CBCT images, which were near 0.6.
| Kappa | Lower 95% CI | Upper 95% CI | |
|---|---|---|---|
| Interrater reliability | |||
| Nonsegmented CBCT | 0.75 | 0.58 | 0.92 |
| Nonsegmented CT | 0.78 | 0.65 | 0.91 |
| Segmented CBCT | 0.59 | 0.30 | 0.87 |
| Segmented CT | 0.87 | 0.79 | 0.95 |
| Intrarater reliability | |||
| Rater 1 | |||
| Nonsegmented CBCT | 0.82 | 0.67 | 0.97 |
| Nonsegmented CT | 0.79 | 0.55 | 1.00 |
| Segmented CBCT | 0.62 | 0.21 | 1.00 |
| Segmented CT | 0.96 | 0.90 | 1.00 |
| Rater 2 | |||
| Nonsegmented CBCT | 0.87 | 0.78 | 0.96 |
| Nonsegmented CT | 0.87 | 0.77 | 0.98 |
| Segmented CBCT | 0.59 | 0.29 | 0.89 |
| Segmented CT | 0.87 | 0.74 | 1.00 |
Since the overall diagnostic accuracy measurements from the 2 raters were similar and their data were at the least moderately reliable with each other, data from rater 2 were used for comparison of diagnostic abilities between nonsegmented CBCT and CT images, and between segmented CBCT and nonsegmented CBCT images, to test the 2 main research hypotheses. Accuracy data from segmented CT images were also collected; overall, they were similar to those from the nonsegmented CT images. Because these data were not directly needed for addressing the main research hypotheses, they were not included in the statistical analyses and thus are not reported in detail here.
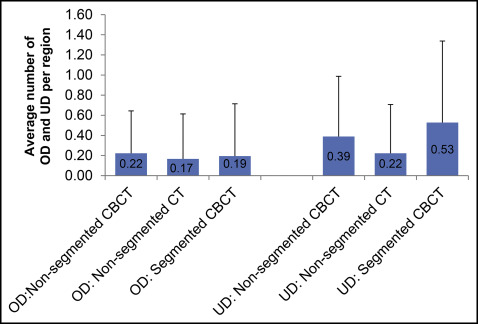
The summarized measurements of overdiagnosis or underdiagnosis per condylar region for each imaging tool or analytic method are shown in Figure 2 . Nonsegmented CBCT images showed a tendency for greater overdiagnosis and underdiagnosis than did the nonsegmented CT images, but the differences were insignificant. Segmentation of the CBCT images tended to slightly reduce the overdiagnosis but increased the underdiagnosis; both differences were statistically insignificant.
Stay updated, free dental videos. Join our Telegram channel
VIDEdental - Online dental courses


