Introduction
The aim of this study was to evaluate the morphologic differences in the mandibular arches of Egyptian and North American white subjects.
Methods
The sample included 94 Egyptian subjects (35 Class I, 32 Class II, and 27 Class III) and 92 white subjects (37 Class I, 29 Class II, and 26 Class III). The subjects were grouped according to arch form types (tapered, ovoid, and square) to compare their frequency distribution between ethnic groups in each Angle classification. The most facial portions of 13 proximal contact areas were digitized on scanned images of mandibular casts to estimate the corresponding clinical bracket point for each tooth. Four linear and 2 proportional measurements were taken.
Results
In comparing arch dimensions, intermolar width was narrower in Egyptians than in the whites ( P = 0.001). There was an even frequency distribution of the 3 arch forms in the Egyptian group. On the other hand, the most frequent arch form was ovoid followed by tapered and square in the white group; the square arch form was significantly less frequent than the tapered and ovoid arch forms ( P = 0.029).
Conclusions
The arch forms of Egyptians are narrower than those of whites. The distribution of the arch form types in Egyptians showed similar frequency, but the square arch form was less frequent in whites. It is recommended to select narrower archwires from the available variations to suit many Egyptian patients.
Correct identification of a patient’s arch form is an important aspect of achieving a stable, functional, and esthetic orthodontic treatment result, since failure to preserve the arch form might increase the probability of relapse. Recently, clinicians have tended to apply lighter forces while taking advantage of self-ligating brackets and small superelastic archwires. However, since the superelastic archwires are preformed, their adaptation to each patient’s unique arch form might be difficult.
To evaluate the arch forms, several classification methods have been developed based on incisal edges and cusp tips as landmarks. However, these methods are not adequately accurate to place the superelastic archwires through the bracket slot points, which lie on the facial axis points. Current investigations have used clinical bracket points as landmarks for mandibular arch-form assessments.
The global application of superelastic archwires has meant that precise arch form assessment has become especially important among different ethnic groups. Cephalometric and anthropometric studies of facial and cranial measurements supported the presence of significant differences among various ethnic groups. However, few studies have examined the anthropometric characteristics of ethnic groups from Egypt. Bishara et al compared the dentofacial relationships of Egyptian and North American adolescents and found significant differences in a number of cephalometric parameters between the 2 ethnic groups. Also, comparisons of maxillary arch forms between Egyptians and others such as white and Saudi samples were reported. No similar studies assessing mandibular arch forms have been conducted. Previous studies showed that the arch forms of white subjects are different from other ethnic groups. The purpose of this study, therefore, was to evaluate the morphologic differences in the mandibular arch between Egyptian and North American white subjects.
Material and methods
The Egyptian sample consisted of 94 mandibular casts (35 Class I, 32 Class II, and 27 Class III) from 73 female and 21 male subjects aged between 13 and 25 years, with a mean age of 18.2 years. The North American white sample included 92 mandibular casts (37 Class I, 29 Class II, and 26 Class III) from 55 female and 37 male subjects aged from 13 to 36 years, with a mean age of 17.3 years. The Egyptian sample was collected from the Department of Orthodontics at Faculty of Oral and Dental Medicine, Cairo University and a private practice in Cairo; the white sample was collected from the Department of Orthodontics at the University of Southern California and a private practice in San Diego, California.
The samples were selected to match the following criteria: (1) full sound permanent dentition excluding third molars; (2) normal tooth size and shape; (3) no supernumerary teeth; (4) arch-length discrepancy of 3 mm or less; (5) no restorations extending to contact areas, cusp tips, or incisal edges; and (6) no previous orthodontic treatment.
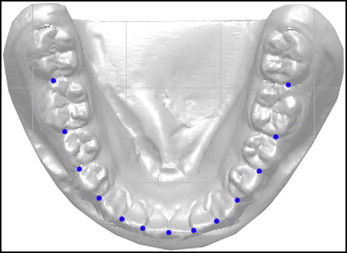
The occlusal surfaces of the mandibular models were scanned with a scanner (Scanjet 4200c, Hewlett-Packard, Palo Alto, Calif; 150 dpi), during which a ruler was included for magnification correction. By using a software program (Autocad 2007, Autodesk, San Rafael, Calif), the most facial portions of 13 proximal contact areas around the arch were digitized to estimate the corresponding clinical bracket point for each tooth ( Fig 1 ). This method was applied to determine a landmark concurring with the facial axis point.
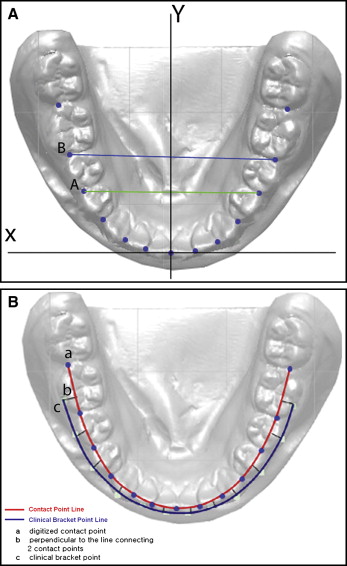
The contact point between the 2 central incisors was taken as the origin of the x and y coordinates. The original x- and y-axes were adjusted so that the mean inclination of line A (straight line connecting the right and left contact points between the first and second premolars) and line B (straight line connecting the right and left contact points between the second premolars and the first molars) become parallel to the original x-axis ( Fig 2 , A ). A line perpendicular to the line connecting the mesial and distal contact points of each tooth was drawn from the midpoint of the mesiodistal line for the anterior teeth and the premolars; for the molars, it was drawn from the point connecting the mesial third to its distal two thirds of that line. According to the data of Andrews of crown prominence, the perpendicular line was extended facially to locate a clinical bracket point for each tooth ( Fig 2 , B ).
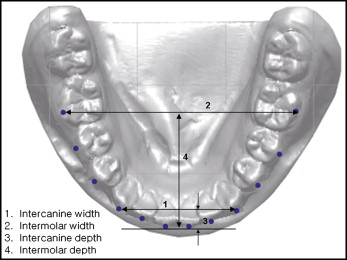
The following 4 linear measurements and 2 proportions were taken ( Fig 3 ): (1) intercanine width: the distance between the canine clinical bracket points; (2) intermolar width: the distance between the first molar clinical bracket points; (3) intercanine depth: the shortest distance from a line connecting the canine clinical bracket points to the origin between the central incisors; (4) intermolar depth: the shortest distance from a line connecting the first molar clinical bracket points to the origin between the central incisors; (5) canine width/depth (W/D) ratio: the ratio of intercanine width to intercanine depth; and (6) molar W/D ratio: the ratio of intermolar width to intermolar depth.
In addition, 12 clinical bracket points per cast were printed in a 1:1 scale and compared with tapered, ovoid, and square arch-form templates (OrthoForm, 3M Unitek, Monrovia, Calif) to select the arch form that best fit the 8 clinical bracket points from the mandibular right first premolar to the left first premolar. The subjects were regrouped according to arch form, and then the frequency distribution of the Angle classifications of each arch form was generated for both ethnic groups.
Statistical analysis
The chi-square test was used to analyze the association between arch form and ethnic group.
Analysis of covariance (ANCOVA) was performed to compare the adjusted means of arch dimensions between the 2 ethnic groups by Angle classification and arch form separately. ANCOVA was also applied to compare sex and Angle classification differences in the white and Egyptian samples. All analyses were tested at the significance level of 0.05.
To assess measurement errors, 24 randomly selected casts from each group were digitized and measured at least 2 weeks later. The differences between the 2 sets of measurements were analyzed. The measurement errors were generally small (less than 5% of the measured mean value) and within acceptable limits.
Also, the sample was classified twice by the same examiner (M.B.). The differences between the 2 evaluations were analyzed by Wilcoxon signed rank test and were negligible ( P >0.05). Therefore, the first classification was used. For confirmation purposes, a second examiner classified a sample of 30 arches of each ethnic group. The agreement between the 2 examiners was high (kappa = 0.898). Both examiners were blinded as to the groups of the arch forms.
Results
Frequency distribution showed an even distribution of the 3 arch forms in the Egyptian group ( P = 0.46). However, in the North American whites, the most frequent arch form was ovoid (42%) followed by tapered (37%) and square (21%), which was significantly less frequent than the tapered and ovoid arch forms ( P = 0.029). The square arch form had the lowest frequency distribution in the Class I and Class II groups in both Egyptians and whites; in the Class III groups, it had the highest frequency distribution. There was no significant difference in the frequency distribution of the 3 arch types between the 2 ethnic groups ( Table I ).
| Egyptian | White | P value | |
|---|---|---|---|
| Total | |||
| Tapered | 30% (28) | 37% (34) | 0.39 |
| Ovoid | 39% (37) | 42% (39) | |
| Square | 31% (29) | 21% (19) | |
| Class I | |||
| Tapered | 40% (14) | 41% (15) | 0.32 |
| Ovoid | 37% (13) | 51% (19) | |
| Square | 23% (8) | 8% (3) | |
| Class II | |||
| Tapered | 34% (11) | 52% (15) | 0.30 |
| Ovoid | 44% (14) | 41% (12) | |
| Square | 22% (7) | 7% (2) | |
| Class III | |||
| Tapered | 11% (3) | 15% (4) | 0.34 |
| Ovoid | 37% (10) | 31% (8) | |
| Square | 52% (14) | 54% (14) | |
Comparisons of arch dimensions showed that the Egyptians had a significantly narrower intermolar width ( P = 0.001) and a smaller molar W/D ratio ( P = 0.006) than did the whites, except for the Class II subjects ( P = 0.82). However, intercanine widths were similar for both ethnic groups, except for Class II subjects ( P = 0.003) ( Table II ). When the arch dimensions were compared among the different Angle classifications in each ethnic group, Class III arches showed significantly larger intercanine ( P <0.01) and molar ( P <0.001) widths than did the Class I and Class II arches in the whites. In the Egyptians, the Class I arches showed significantly smaller intercanine ( P <0.05) and molar ( P <0.001) widths than did the Class II and III arches ( Table II ).
| Class I (n = 72) |
Class II (n = 61) |
Class III (n = 53) |
Total (n =186) |
Multiple comparison among Angle classifications in whites |
P value, respectively |
Multiple comparison among Angle Classification in Egyptians |
P value respectively |
|||||||||
|---|---|---|---|---|---|---|---|---|---|---|---|---|---|---|---|---|
| Arch dimension | Egyptian (n = 35) |
White (n = 37) |
P value | Egyptian (n = 32) |
White (n = 29) |
P value | Egyptian (n = 27) |
White (n = 26) |
P value | Egyptian (n = 94) |
White (n = 92) |
P value | ||||
| Intercanine width (mm) | 28.5 ± 1.80 | 28.3 ± 1.39 | 0.74 | 29.6 ± 2.01 | 28.1 ± 1.50 | 0.003 ∗ | 29.7 ± 2.14 | 30.0 ± 1.99 | 0.57 | 29.2 ± 2.05 | 28.7 ± 1.74 | 0.07 | III >I, II | 0.004, 0.001 | I <II, III | 0.010, 0.009 |
| Intercanine depth (mm) | 4.90 ± 1.26 | 5.00 ± 0.79 | 0.72 | 5.70 ± 1.34 | 5.40 ± 1.00 | 0.41 | 4.90 ± 1.14 | 4.80 ± 1.27 | 0.69 | 5.20 ± 1.29 | 5.1 ± 1.02 | 0.59 | NS | NS | II >I, III | 0.010, 0.015 |
| Intermolar width (mm) | 45.7 ± 3.32 | 48.2 ± 1.92 | <0.0001 ‡ | 48.4 ± 2.53 | 48.3 ± 2.87 | 0.82 | 48.8 ± 4.08 | 51.6 ± 3.02 | 0.007 † | 47.5 ± 3.63 | 49.1 ± 2.86 | 0.001 † | III >I, II | <0.001 | I <II, III | <0.001 |
| Intermolar depth (mm) | 25.4 ± 2.15 | 25.4 ± 1.52 | 0.98 | 26.1 ± 2.27 | 25.3 ± 1.67 | 0.18 | 25.6 ± 1.86 | 25.7 ± 2.56 | 0.87 | 25.6 ± 2.10 | 25.5 ± 1.90 | 0.60 | NS | NS | NS | NS |
| Canine W/D ratio | 6.20 ± 1.61 | 5.80 ± 0.97 | 0.24 | 5.50 ± 1.22 | 5.40 ± 1.07 | 0.85 | 6.30 ± 1.14 | 6.60 ± 1.56 | 0.35 | 6.00 ± 1.39 | 5.90 ± 1.25 | 0.65 | III >I, II | 0.032, 0.002 | II <I, III | 0.036, 0.021 |
| Molar W/D ratio | 1.80 ± 0.18 | 1.90 ± 0.13 | 0.009 † | 1.90 ± 0.19 | 1.90 ± 0.17 | 0.35 | 1.90 ± 0.21 | 2.00 ± 0.21 | 0.047 ∗ | 1.87 ± 0.20 | 1.94 ± 0.17 | 0.006 † | III >I, II | 0.020, 0.032 | I <III | 0.011 |
The Egyptians had significantly narrower intermolar widths than the whites in all 3 arch-form groups and also had significantly smaller molar W/D ratios in the tapered and square arch-form groups. As the mandibular arches changed in form from tapered to ovoid to square, both ethnic groups showed significant increases in intercanine and intermolar widths, and canine and molar W/D ratios. However, significant decreases in intercanine depth were observed as the arches changed from tapered to ovoid to square, whereas intermolar depth tended to decrease ( Table III ).
Stay updated, free dental videos. Join our Telegram channel
VIDEdental - Online dental courses


