Introduction
The cervical vertebral maturation (CVM) stages have been used to estimate facial growth status. In this study, we examined whether cone-beam computed tomography images can be used to detect changes of CVM-related parameters and bone mineral density distribution in adolescents during orthodontic treatment.
Methods
Eighty-two cone-beam computed tomography images were obtained from 41 patients before (14.47 ± 1.42 years) and after (16.15 ± 1.38 years) orthodontic treatment. Two cervical vertebral bodies (C2 and C3) were digitally isolated from each image, and their volumes, means, and standard deviations of gray-level histograms were measured. The CVM stages and mandibular lengths were also estimated after converting the cone-beam computed tomography images.
Results
Significant changes for the examined variables were detected during the observation period ( P ≤0.018) except for C3 vertebral body volume ( P = 0.210). The changes of CVM stage had significant positive correlations with those of vertebral body volume ( P ≤0.021). The change of the standard deviation of bone mineral density (variability) showed significant correlations with those of vertebral body volume and mandibular length for C2 ( P ≤0.029).
Conclusions
The means and variability of the gray levels account for bone mineral density and active remodeling, respectively. Our results indicate that bone mineral density distribution and the volume of the cervical vertebral body changed because of active bone remodeling during maturation.
Evaluation of patients’ facial growth status is important in developing optimal orthodontic treatment plans. Skeletal maturity status should be considered to determine effective timing for the use of growth-modification appliances such as Class II functional appliances and headgears. It has been demonstrated that the cervical vertebrae (C2 to C6) are a valid anatomic reference for estimating skeletal maturation, providing comparable results with those obtained by hand-wrist radiographic assessment. The cervical vertebral maturation (CVM) method has been widely used to estimate the skeletal maturity for orthodontists. However, many clinical studies observed that the CVM method has poor reliability and repeatability for evaluation of bone maturity.
A major limitation of the CVM method is that it classifies the stages of maturation based on qualitative descriptions of cervical vertebral shape on a 2-dimensional (2D) cephalogram. Thus, the estimated CVM stages vary because of possible observer bias. On the other hand, more dental providers are using 3-dimensional (3D) images of clinical cone-beam computed tomography (CBCT) for diagnosis and treatment planning. Since the CBCT image field of view can include the cervical vertebrae, recent studies have examined the applicability of CBCT to the assessment of skeletal maturity. However, those studies investigated only the general morphology of the cervical vertebrae, whereas CBCT can provide additional information including bone mineral density (BMD).
It was observed that the BMD changes reflect the physiology of bone development during childhood and adolescence. A clinical computed tomography image has been used as a standardized method to assess orthopedic BMD. Many clinical studies have indicated that CBCT images can be used for volumetric assessment of BMD. Combining the observations from these previous studies, we hypothesized that the clinical CBCT-based 3D morphologic and volumetric BMD analyses for the cervical vertebrae can provide quantitative information to estimate a patient’s skeletal maturity. Thus, the objectives of this study were to examine (1) whether CBCT images can be used to detect changes of cervical vertebral volume and BMD distribution and (2) whether those changes are associated with changes of the CVM stages and mandibular length. We used a longitudinal comparison of those parameters measured in teenaged patients before and after orthodontic treatment.
Material and methods
The institutional review board of Ohio State University approved this retrospective study. The CBCT images were originally taken as diagnostic pretreatment and posttreatment records on routine orthodontic patients at a collaborating university’s graduate orthodontic clinic. This is their standard record procedure. Patients received comprehensive orthodontic treatment with full fixed appliances and were excluded if they had craniofacial anomalies, facial asymmetries, orthognathic surgery, rapid palatal expansion, headgear, or extractions (except third molars). Each image was taken at 2 mA and 120 kV with a Hitachi CB MercuRay scanner (Hitachi Medical Systems America, Twinsburg, Ohio) ( Fig 1 ). The voxel size of the 3D CBCT image was either 292 or 377 μm. Eighty-two paired images from 41 patients (15 boys, 26 girls) randomly selected before (T1) and after (T2) orthodontic treatment were included for this study. The average patient ages were 14.47 ± 1.42 years at T1, and 16.15 ± 1.38 years at T2. Individual patient treatment duration ranged from 9 to 26 months, with an average duration of 20.17 months.
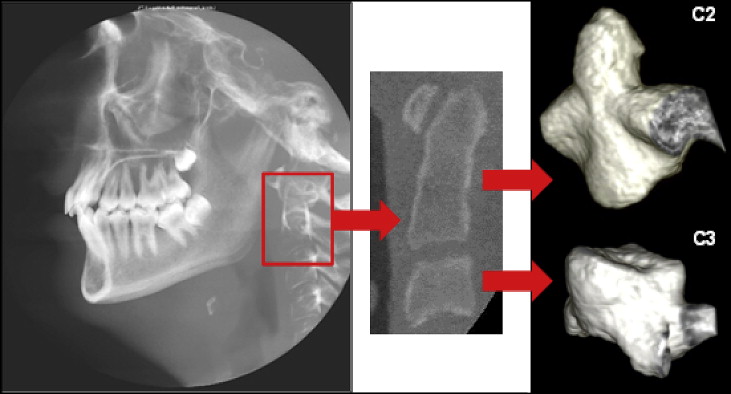
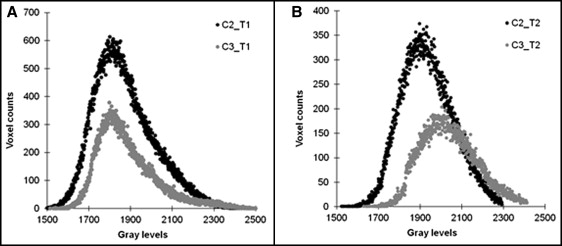
The 3D CBCT images were imported to image-analysis software (ImageJ, National Institutes of Health, Bethesda, Md). Two cervical vertebrae (C2 and C3) in the same CBCT image were digitally cropped, separated, and saved as individual image files ( Fig 1 ). Segmentation of bone voxels from nonbone voxels outside the vertebrae was performed automatically using a heuristic algorithm as in previous studies. Posterior processes were digitally removed at 10 voxels from each side of the vertebral end plate, leaving only the vertebral body in the final image ( Fig 1 ). Vertebral body volume was estimated by multiplying the total bone voxel counts after segmentation by the volume per voxel. The gray level of each bone voxel, which is equivalent to BMD, was maintained inside the vertebral body during the segmentation process. Gray-level histograms were obtained for the C2 and C3 vertebral bodies at T1 and T2 ( Fig 2 ). A mean value was computed by dividing the sum of gray levels by the total count of voxels, and a standard deviation of gray- level distribution was also computed using the histogram for each vertebral body. We used BMD-equivalent gray levels that were obtained from both bone and nonbone (bone marrow) voxels inside the vertebral body because the rough resolution of the clinical images limited precise segmentation between those voxels. Thus, our gray-level values are comparable with conventional BMD values, but they would not be identical to those of bone tissue mineral density-equivalent gray levels that were obtained from only bone voxels in a previous study.
The CVM stage and mandibular length were assessed in 2D cephalometric views by converting the same 3D CBCT images to their corresponding 2D lateral cephalometric views with orthodontic imaging software (Dolphin3D; Dolphin Imaging & Management Solutions, Chatsworth, Calif). The CVM stage was assigned according to the 5-stage method developed previously. This method categorizes patients into 1 of 5 stages based on the shape of the cervical vertebrae (C3 and C4) by assessing whether they are trapezoidal or rectangular in the horizontal dimension, square, or rectangular in the vertical dimension, and by evaluating for the presence or absence of a concavity on the inferior borders of C2, C3, and C4. When using this method, peak mandibular growth is presumed to occur between stages II and III. The mandibular length was measured using the same 2D cephalometric view for each patient at T1 and T2. The mandibular length measurement was based on the distance from condylion, which was defined as the most posterior-superior point on the condyle, to anatomic gnathion, which was defined as the midpoint between the most anterior-inferior point on the bony chin.
All CVM stage evaluations were performed by a blinded examiner (B.C.) using the randomly coded CBCT images. Five images were randomly selected for repeated measurements by the same examiner for an intrarater reliability test. An additional 5 images were randomly selected and evaluated by a second examiner (E.J.) to determine the interrater reliability. Intrarater and interrater agreements were analyzed with the intraclass correlation coefficient with the Shrout-Fleiss random set method and single score method, respectively (SAS[r] Proprietary Software 9.2; SAS Institute Inc, Cary, NC). Although this statistical test is intended for continuous rather than ranked data, this data set was perfectly ranked, making this an appropriate evaluation.
A paired t test was used to compare the vertebral variables (mean, standard deviation, and vertebral volume), CVM stage, and mandibular length between T1 and T2. The changes in all parameters between T1 and T2 were obtained using an absolute difference by subtracting measurements at T1 from those at T2. Then, the paired t test was used to compare the values and the changes of the vertebral parameters (mean, standard deviation, and vertebral volume) between C2 and C3. Pearson correlations were examined for all parameters between T1 and T2, and also between changes of the vertebral parameters and the mandibular length. Spearman rank correlations were tested between changes of the CVM stage and all other parameters. Significance was set at P ≤0.05.
Results
Interrater reliability between the 2 raters (B.C. and E.J.) was 0.54 for CVM. Intrarater reliability for the first rater was 0.90 for the same variable.
The cervical vertebrae were successfully isolated from the CBCT images ( Fig 1 ), providing the gray-level histograms at T1 and T2 ( Fig 2 ).
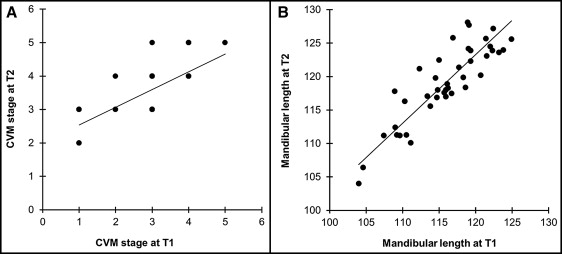
All variables at T1 had significant positive correlations with those at T2 ( P ≤0.027). The correlations between T1 and T2 of the CVM stage and mandibular length are shown in Figure 3 .
The BMD means of both C2 and C3, CVM stage, and mandibular length significantly increased during the observation period ( P <0.001) ( Table I ). The BMD standard deviation and vertebral body volume of C2 significantly decreased ( P ≤0.018); the BMD standard deviation of C3 significantly decreased ( P ≤0.006), but the vertebral body volume of C3 was not significantly different ( P = 0.210) during the observation period.
| Parameter | T1 | T2 | P value |
|---|---|---|---|
| BMD mean | |||
| C2 | 1948.312 ± 81.873 | 1997.257 ± 50.028 | <0.001 |
| C3 | 1969.746 ± 87.370 | 2054.788 ± 2.916 | <0.001 |
| BMD SD | |||
| C2 | 141.635 ± 27.739 | 121.063 ± 13.299 | <0.001 |
| C3 | 133.530 ± 23.642 | 120.504 ± 13.829 | <0.001 |
| Vertebral body volume (mm 3 ) | |||
| C2 | 6348.342 ± 1109.801 | 5652.91 ± 1933.960 | 0.018 |
| C3 | 3411.728 ± 671.176 | 3205.432 ± 1115.353 | 0.210 |
| CVM stage | 2.927 ± 1.010 | 3.561 ± 0.776 | <0.001 |
| Mandibular length (mm) | 115.827 ± 5.261 | 119.022 ± 5.813 | <0.001 |
The mean of the gray levels for the C2 vertebral body was significantly lower than that for the C3 vertebral body at both T1 and T2 ( P <0.001) ( Table I ). In contrast, the mean of the standard deviation values for the C2 vertebral body was significantly higher than that for the C3 vertebral body at T1 ( P <0.001), whereas no significant difference was detectable at T2 ( P = 0.669). The mean of the vertebral body volume for the C2 vertebral body was significantly higher than that for the C3 vertebral body at both T1 and T2 ( P <0.001).
The changes of BMD mean and standard deviation were significantly different between C2 and C3, as was the vertebral body volume ( P <0.001) ( Table II ).
| Variable | C2 vertebral body | C3 vertebral body | P value |
|---|---|---|---|
| ΔT BMD mean | 65.022 ± 44.566 | 91.450 ± 55.838 | <0.001 |
| ΔT BMD SD | 27.773 ± 18.285 | 21.606 ± 13.086 | <0.001 |
| ΔT (vertebral body volume) (mm 3 ) | 1436.676 ± 1270.435 | 850.389 ± 612.565 | <0.001 |
| ΔT (CVM stage) | 0.63 ± 0.733 | ||
| ΔT (mandibular length) (mm) | 3.278 ± 2.717 | ||
The changes of BMD standard deviation for C2 were significantly correlated with those of vertebral body volume and mandibular length ( P ≤0.029) ( Table III ). The changes of BMD standard deviation for C3 and that of mandibular length were significantly correlated ( P = 0.018). The changes of vertebral body volume and CVM were positively correlated for both C2 and C3 ( P ≤0.021).


