Introduction
Although the scientific literature recognizes that lateral cephalometric radiographs might be clinically useful, there is no consensus in relation to the best parameter available. Therefore, this research was aimed at evaluating current radiographic assessment methods designed to investigate adenoid hypertrophy and nasopharyngeal obstruction.
Methods
Children from 4 to 14 years old with nasal obstruction or oral breathing complaints, suspected to be caused by adenoid hypertrophy, received cephalometric examinations. One hundred twenty radiographic records were evaluated according to several current methods, and data were compared with respective gold-standard videonasopharyngoscopic examinations, in relation to the percentage of choanal obstruction.
Results
Groups derived from a grading system had significantly different percentages of choanal obstruction. However, this parameter showed low sensitivity. Significant but moderate correlations were observed between most of the quantitative radiographic parameters and the percentage of choanal obstruction. Alternatively, a regression model was introduced; it demonstrated satisfactory ability to predict choanal obstruction percentage. Despite limitations, this model could also distinguish patients who might benefit from referral to otolaryngologic care.
Conclusions
Current adenoid assessment methods have significant limitations. A novel assessment method introduced here might be clinically useful.
Adenoid hypertrophy is an important cause of nasal obstruction and is commonly related to many symptoms, including mouth breathing. As a consequence, oral respiration leads to significant neuromuscular and soft-tissue rearrangements, which might result in distorted craniofacial growth and orthodontic alterations.
Due to the close relationship among adenoids, upper airway obstruction, and orthodontic deviations, many studies have been developed aiming to evaluate lateral cephalometric radiographs as diagnostic tools for the detection of hypertrophic adenoids. It is known, however, that static, bidimensional radiographic images provide limited information when evaluating a complex and dynamic anatomic region.
Videonasopharyngoscopy, on the other hand, is tridimensional and allows direct and dynamic visualization of the nasopharynx. Because videonasopharyngoscopy has higher rates of correlation with obstructive symptoms compared with radiographic examinations and has proved to be perfectly reliable for the detection of adenoid obstruction, it is frequently chosen as the finest diagnostic tool to corroborate the indications for adenoidectomy.
However, because lateral cephalometric radiographs are readily accessible, the usefulness of radiographic parameters to evaluate adenoid hypertrophy and nasopharyngeal obstruction has still been a reason for considerable attention in the literature. Most of these studies have created and evaluated diverse investigational tools, and as a consequence many radiographic parameters and much scientific evidence were produced.
Two systematic reviews aiming to investigate those assessment tools were then performed. Although assuming that lateral radiographs might be clinically useful, neither study is fully conclusive as to the best parameter available. Part of this uncertainty stems from the fact that these parameters have not been analyzed simultaneously. In addition, among the studies that were systematically analyzed, few evaluated the performance of the radiographic parameters according to appropriate methods and study designs.
Therefore, the aim of this research was to evaluate the performance of several cephalometric parameters designed to evaluate hypertrophic adenoids and nasopharyngeal obstructions. These assessment tools were investigated concerning their associations with videonasopharyngoscopy examinations, and their practical applicability is discussed. In addition, we aimed to present a new and potentially useful assessment method in this study.
Material and methods
This research was a cross-sectional diagnostic study, approved by the institutional ethics review board (protocol 0181/08) of the Federal University of São Paulo in Brazil.
To compose the study sample, 170 children from a public pediatric otolaryngologic referral center were invited to participate; of them, 43 refused to take part.
Thus, 127 children (age range, 4-14 years) of both sexes agreed to be part of the study, and informed consent was properly obtained. To meet the inclusion criteria, the patients must have had complaints about nasal obstruction or mouth breathing, suspected to be caused by adenoid hypertrophy. Children with congenital syndromes or head and neck malformations were excluded. Subjects with acute infections of the respiratory tract or a history of previous adenoidectomy or orthodontic treatment were also excluded.
All children had lateral cephalometric radiograph examinations, performed by 1 radiology specialist using the same device (Instrumentarium Ortopantomographic OP100; General Electric Healthcare, Tuusula, Finland). The focus-to-film distance was 140 cm, and the x-ray exposure settings were 70 kV and 12 mA. The patients were instructed to breathe exclusively through the nose and keep their lips gently sealed. We used 20 × 25 cm films (Kodak, Rochester, NY) and processed them according to the standardized protocol. Lateral cephalometric records showing elevation of the soft palate or significant rotation of the head were not used.
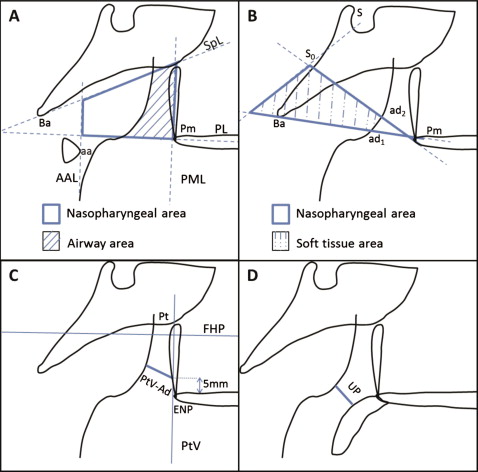
The lateral cephalometric radiographs were coded with numbers and hand-traced by 1 researcher (M.F.N.F.), who was unaware of each subject’s identification and the severity of adenoid hypertrophy. This examiner, an orthodontist, made several radiographic measurements ( Table I , Fig 1 ) Tracings were made with a negatoscope on acetate Ultraphan films (3M Unitek, Campinas, Brazil). Linear measurements were determined with a digital caliper (model 799A-8/200; Starrett, Itu, Brazil), and area calculations for airway area and soft-tissue area were made with Image J software ( http://rsbweb.nih.gov/ij ).
| Reference | Assessment method and description |
|---|---|
| Handelman and Osborne | Airway area (Aa) (%): (airway area/nasopharyngeal area) x 100 ( Fig 1 , A ) |
| Schulhof | PtV-Ad (mm): the nearest distance from adenoid outline to PtV (5 mm above the posterior nasal spine) ( Fig 1 , C ) |
| Linder-Aronson and Leighton | Sagittal depth (1) of the airway (Pm-ad1) (mm) ( Fig 1 , B ) |
| Sagittal depth (2) of the airway (Pm-ad2) (mm) ( Fig 1 , B ) | |
| Thickness (1) of the soft tissue (ad1-Ba) (mm) ( Fig 1 , B ) | |
| Thickness (2) of the soft tissue (ad2-S0) (mm) ( Fig 1 , B ) | |
| Soft-tissue area (Ad/Np) (%): (soft-tissue area/nasopharyngeal area) x100 ( Fig 1 , B ) | |
| Sagittal depth of the bony nasopharynx (Pm-Ba) (mm) ( Fig 1 , B ) | |
| McNamara | Upper pharynx (UP) (mm): nearest distance from a point on the posterior outline of the soft palate and a point on the adenoid outline ( Fig 1 , D ) |
| Airway grading: “nonobstructive” (UP >5), “apparently obstructive” (UP ≤5) |
On the same day as the radiographic examinations, our subjects had videonasopharyngoscopy examination, performed by experienced otolaryngologists. The examinations were made with a flexible fiber-optic nasopharyngoscope (model ENFP4, 3.4 mm; Olympus, Melville, NY) with a 250-W halogen light. All examinations were performed after topical application of 2% lidocaine to both nostrils. At any sign of discomfort, the examination was interrupted. Uncooperative patients who did not provide satisfactory records of at least 1 nasal cavity side were excluded.
All examinations were recorded on a DVD recorder (model DVD-R150/XAZ; Samsung, Manaus, Brazil). The digital file derived from the recorded video was then edited, so that anonymity of the patients was preserved. Also, images of anatomic structures that were not related to the nasopharyngeal region were suppressed.
The edited clips were coded with numbers and handed to the examiner (J.S.H.), an experienced otolaryngologist, who was not involved with the subjects’ enrollment, videonasopharyngoscopy performance, recording, and editing. This examiner was also unaware of the radiographic examination outcomes.
To evaluate the videonasopharyngoscopy clips, this examiner used an assessment method that was designed to quantify the degree of obstruction caused by the adenoid tissue: “measured choanal obstruction.”
This evaluator chose the frame that would provide the best view of the adenoid tissue in relation to the choanal space, obtained from the most distal portion of the inferior turbinate. At these frames, the patients were supposed to be breathing exclusively through the nose, with no evidence of soft-palate elevation. The selected frames were then converted into digital files (JPEG format), and the measured choanal obstruction was finally calculated by the software Image J. To do so, first the adenoid tissue area and then the choanal area was calculated. Measured choanal obstruction referred to the percentage of the choanal area occupied by the adenoid tissue ( Fig 2 ). If examinations through both nostrils were accomplished, the average between the right and left sides was calculated to minimize occasional variations.
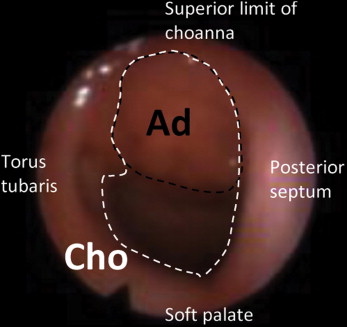
( Measured choanal obstruction = ( A d C h o ) × 100 )
, Ad , Adenoid area; Cho , choanal area.
Stay updated, free dental videos. Join our Telegram channel
VIDEdental - Online dental courses


