Introduction
The aim of this study was to use the finite element method to evaluate the distribution of stresses and strains on the local bone tissue adjacent to the miniplate used for anchorage of orthodontic forces.
Methods
A 3-dimensional model composed of a hemimandible and teeth was constructed using dental computed tomographic images, in which we assembled a miniplate with fixation screws. The uprighting and mesial movements of the mandibular second molar that was anchored with the miniplate were simulated. The miniplate was loaded with horizontal forces of 2, 5, and 15 N. A moment of 11.77 N·mm was also applied. The stress and strain distributions were analyzed, and their correlations with the bone remodeling criteria and miniplate stability were assessed.
Results
When orthodontic loads were applied, peak bone strain remained within the range of bone homeostasis (100-1500 μ strain) with a balance between bone formation and resorption. The maximum deformation was found to be 1035 μ strain with a force of 5 N. At a force of 15 N, bone resorption was observed in the region of the screws.
Conclusions
We observed more stress concentration around the screws than in the cancellous bone. The levels of stress and strain increased when the force was increased but remained within physiologic levels. The anchorage system of miniplate and screws could withstand the orthodontic forces, which did not affect the stability of the miniplate.
Temporary skeletal anchorage devices, such as palatal implants, mini-implants, and miniplates, have been incorporated into orthodontic treatment, thereby expanding the limits of tooth movement, especially in uncooperative patients and those with many missing teeth or a complex malocclusion.
The miniplates introduced by Umemori et al are anchorage devices that are indicated for the treatment of severe malocclusion and large tooth movements, such as in molar intrusion or retraction, for which anchorage control can be difficult. The success rate of miniplates is well above 90%; however, failure of the miniplate system leads to miniplate mobility and consequently early miniplate removal. Surgical trauma, local inflammation, some specific anatomic structures close to the miniplate, and insufficient bone density are some factors related to miniplate failure. The loss of miniplate stability can also be due to biomechanical problems and the effects of stress generated by the applied forces around the screws.
In plates used for osteosynthesis, the loss of screws was associated with high levels of stress at the screw-bone interface, which indicates a relationship between stress or strain and bone resorption around the screws. With respect to dental implants, a direct relationship exists between bone resorption and loading; however, very high or very low levels of strain lead to a negative balance in bone remodeling. Using miniplates for anchorage results in a load that seems to be a central aspect of the device’s stability because the magnitude of the increase in strength leads to increased tensions in the region of the screws.
Few studies have evaluated the influence of orthodontic forces on the biomechanical behavior of bone tissues around miniplates. This is critical because a positive effect on local loading of bone turnover might induce an excessive bone response and result in difficulty in removing the miniplate, whereas a negative effect might reduce its stability.
Therefore, the aim of this study was to use the finite element method to simulate the stress and the deformation that occur in the bone adjacent to the miniplate when loads are applied.
Material and methods
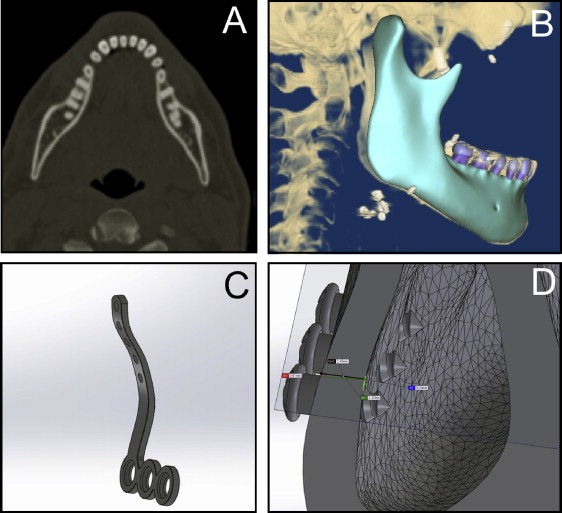
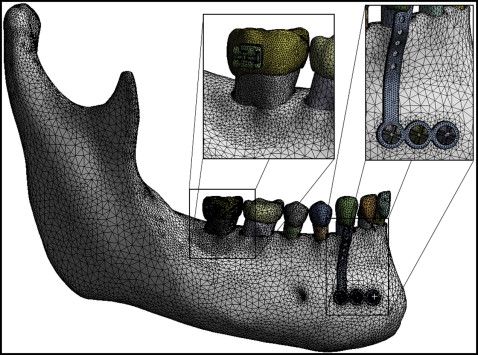
A 3-dimensional (3D) model of the mandible and the teeth was reconstructed from dental computed tomographic images obtained from the DICOM-image repository ( www.osirix-viewer.com/datasets ). The geometric model was created in the format using software (version 4.7; Simpleware, Exeter, United Kingdom), and it was exported to the SolidWorks software (version 11.0; Dassault Systèmes, Waltham, Mass; http://www.solidworks.com/sw/183_ENU_HTML.htm ). The stereolithography computer-aided design was transformed into a solid model, and the miniplate and screws (SAO; RAHOS, São Paulo, Brazil; http://rahos.com.br/ ) were inserted ( Fig 1 ). The final 3D model was composed of a hemimandible, an L-shaped titanium miniplate (1 mm thick), and 3 titanium screws (2 mm in diameter, 5 mm in length). The hemimandible was composed of teeth (dentin, enamel, and periodontal ligament), cancellous bone, and cortical bone (2.3 mm thick). The model was exported to ANSYS software (version 12.1; Swanson Analysis, Pittsburgh, Pa) for the finite element analysis.
All materials were considered to be isotropic and homogeneous with linear elastic mechanical behavior. This approach allowed a qualitative evaluation of the results, which was the aim of this study. The modulus of elasticity and the Poisson coefficient of the materials used in the simulation—titanium, cortical bone, cancellous bone, enamel, dentin, and periodontal ligament—were obtained from the literature and are listed in Table I .
| Material | Elastic modulus (E) (MPa) | Poisson coefficient (v) |
|---|---|---|
| Cortical bone | 13800 | 0.26 |
| Cancellous bone | 345 | 0.31 |
| Enamel | 84100 | 0.20 |
| Dentin | 18600 | 0.31 |
| Periodontal ligament | 0.68 | 0.49 |
| Titanium | 96000 | 0.36 |
| Steel | 193000 | 0.31 |
The contact between the screws and the holes of the miniplate, the contact between the screws and the bone, and the contact between the teeth and the bone were considered to be perfect. Simulation was performed with the contact element type “bonded,” which does not allow sliding or separation between the faces. The contour regions were set to prevent interference with the region of interest from the simulation. The mandible was fixed in the head of the mandible and the lower posterior region of the mandibular body.
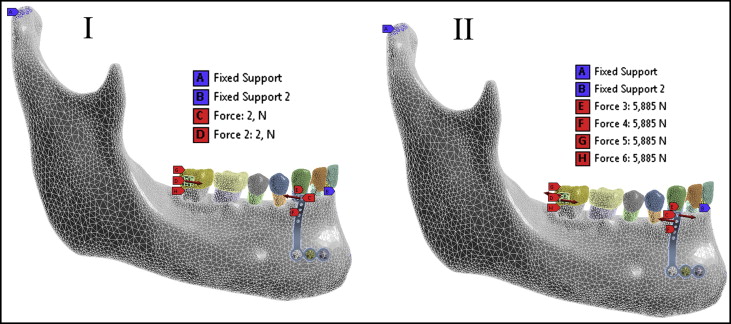
The mechanical model is shown in Figure 2 . The finite element mesh consisted of 573,066 nodes and 9,645,858 elements. The elements used to recreate the materials were the quadratic tetrahedral type defined by 10 nodes with 3 degrees of freedom at each node, represented in the x-, y-, and z-axes.
The loading was performed to simulate the mesial movements and the uprighting of the mandibular second molar ( Fig 3 ). The following 6 load conditions were simulated.
-
Load 1: load of 2 N, representing orthodontic force in the anteroposterior direction, was applied at the end of the miniplate and the bracket of the mandibular second molar, simulating mesial movement of that molar.
-
Load 2: load of 5 N, representing orthopedic force in the anteroposterior direction, was applied at the edge of the miniplate and the bracket of the mandibular second molar.
-
Load 3: a 11.77-N·mm (1200 gf.mm) moment was applied in the clockwise direction to the edge of the miniplate, thereby generating a counterclockwise movement of the mandibular second molar. The application of this load simulates the uprighting movement of the second molar.
-
Load 4: a 2-N anteroposterior force and an 11.77-N·mm moment were applied to the edge of the miniplate and to the mandibular second molar bracket. The application of this load causes simultaneous mesial movement and uprighting of the mandibular second molar.
-
Load 5: an anteroposterior load of 5 N and an 11.77-N·mm moment were applied at the edge of the miniplate and to the mandibular second molar.
-
Load 6: a 15-N anteroposterior force was applied to the edge of the miniplate to achieve the level of force that would induce bone deformities with levels above 3000 μ strain.
The area next to the miniplate was selected as the region of interest in this study. The following analyses were performed: (1) maximum principal deformations in bone (ε1, traction), (2) minimum principal deformations in bone (ε3, compression), (3) maximum principal stress in bone (σ1, traction), and (4) minimum principal stress on the bone (σ3, compression).
Results
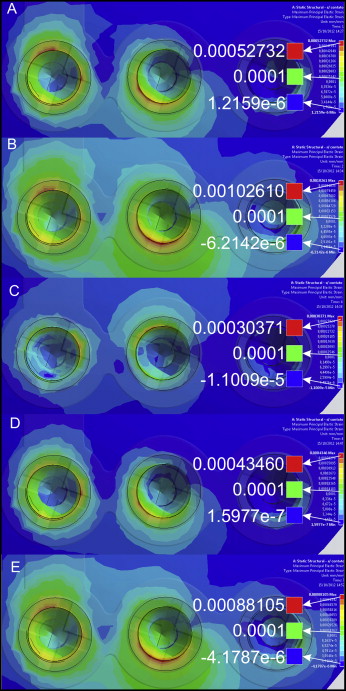
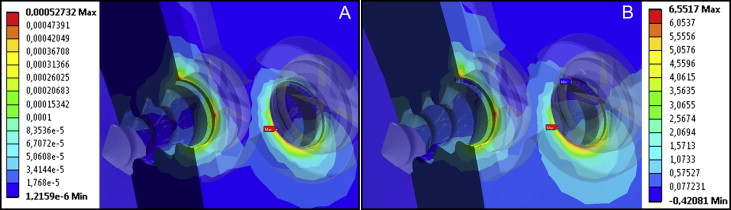
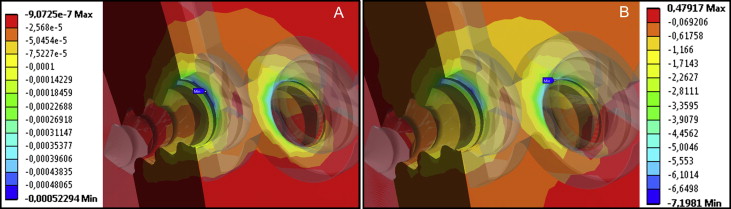
The stresses (in MPa) and strains (in μ strain) occurring in the bone tissues were calculated and presented in a range of colors. Different colors represent different levels of strain and stress on the element analyzed. Red represents the maximum amount of stress (tension) and the maximum deformation (compression); blue represents the minimum amount of pressure (compression) and the minimum deformation (tensile). Positive or negative values in the voltage range indicate tension or compression, respectively ( Table II ).
| Load | Maximum principal strain (μ strain) | Minimum principal strain (μ strain) | Maximum principal stress (MPa) | Minimum principal stress (MPa) |
|---|---|---|---|---|
| 1 | 527.3 | −522.9 | 6.55 | −7.19 |
| 2 | 1026.1 | −1035.3 | 14.41 | −14.97 |
| 3 | 303.7 | −303.4 | 3.81 | −4.12 |
| 4 | 434.6 | −424.6 | 5.39 | −5.39 |
| 5 | 881.0 | −879.4 | 12.4 | −12.65 |
| 6 | 3100.2 | −3208.5 | 43.46 | −45.72 |
The distribution of the maximum principal strains (loads 1-5) can be seen in Figure 4 . Figures 5 and 6 show the distributions of the maximum principal stresses and strains, respectively, during traction and in compression at load 1. Upon analysis of loads 1 to 5, the maximum tensile strain was found at 1026 μ strain when the force applied was 5 N (load 2). During compression, the peak was found to be 1035.3 μ strain, also with force of 5 N. Load 6 was exposed to a force of 15 N when the strain exceeded physiologic limits (μ strain 3000), as shown in Figure 7 .