Introduction
Type 2 diabetes is known to affect bone metabolism. In this study, we aimed to determine the effects of type 2 diabetes on bone remodeling during orthodontic tooth movement.
Methods
The 48 rats were divided into 4 groups: Wistar control group (n = 8), Goto-Kakizaki (GK) control group (n = 8), Wistar appliance group (n = 16), and GK appliance group (n = 16). The distances between the teeth were measured weekly. On day 42, maxillary alveolar bone specimens were obtained for histologic evaluation and determination of the gene expression levels of the receptor activator of nuclear factor ҡB (RANK), RANK ligand (RANKL), and osteoprotegerin (OPG).
Results
No significant difference was observed in the levels of tooth movement between the 2 appliance groups. After orthodontic force application, the alveolar bone volume and osteoblast surface in the GK rats were diminished compared with those in the Wistar rats. The increase in the osteoclast surface relative to the control groups was 2.4-fold greater in the GK rats than in the Wistar rats. Significant upregulations of the RANK and OPG gene expression levels in the Wistar appliance group were observed. The RANKL/OPG ratio was increased in the GK appliance group compared with the Wistar appliance group.
Conclusions
Diminished bone formation and slightly increased bone resorption were observed during orthodontic tooth movement in the rats with type 2 diabetes.
Highlights
- •
We investigated bone remodeling during orthodontic tooth movement in rats with type 2 diabetes.
- •
Goto-Kakizaki rats were used as the diabetes animal model; Wistar rats were the controls.
- •
Diminished bone formation was present after force application in rats with type 2 diabetes.
- •
A slight increase in bone resorption was found during tooth movement in the rats with diabetes.
- •
An increased rate of orthodontic tooth movement in patients with diabetes should not be expected.
Diabetes is a common metabolic disorder that is characterized by chronic hyperglycemia. Changes in bone structure and its metabolism in the diabetic state have been reported. Diabetic osteoporosis has been well documented in type 1 diabetes (T1D). In rat models of T1D, decreased rates of bone turnover have been observed. In a study conducted by Abbassy et al, fewer osteoclast cells and impaired bone formation were observed in T1D rats compared with the control rats. Additionally, decreased trabecular thickness and trabecular numbers were observed, indicating the deterioration of bone quality in T1D. The association between type 2 diabetes (T2D) and bone mineral density is less clear. Increased, decreased, and unchanged bone volumes have been observed. These contradictory findings could be partially attributed to various confounding factors, such as obesity, which tends to be associated with increased bone volume and is prevalent in persons with T2D. In a study in which nonobese, spontaneous T2D Goto-Kakizaki (GK) rats were used, decreased trabecular bone volume and trabecular thickness were found. In the same study, the analysis of bone metabolism biochemical markers in the blood indicated less bone formation and greater bone resorption. In addition, impaired bone formation in the T2D rat model has been associated with the reduced proliferation and diminished function of osteogenic cells. Higher osteoclastic activity might partially contribute to the increase in bone resorption in T2D rats.
Bone remodeling is an essential process for tooth movement during orthodontic treatment. The receptor activator of nuclear factor ҡB (RANK), its ligand (RANKL), and osteoprotegerin (OPG) interact to regulate the bone remodeling process and, therefore, play roles in orthodontic tooth movement as well. The binding of RANKL, which is expressed on osteoblast cells, to RANK, which is expressed on osteoclast precursor cells, results in the differentiation of these cells into mature osteoclasts. OPG, which competes with RANK for RANKL binding, inhibits osteoclast differentiation. Increases in the RANKL level and the RANKL to OPG ratio in gingival crevicular fluid have been observed during orthodontic tooth movement. In T2D, lower OPG and slightly higher RANKL gene expression levels have been observed in rat tibiae.
Studies regarding orthodontic tooth movement in the diabetic state have been scarce and inconclusive. Decreased numbers of osteoclasts and osteoblasts, but no changes in bone volume, have been observed in a T1D rat model at 48 hours after force application. In contrast, during force application, elevated numbers of osteoclasts were present for a longer time in the T1D rats than in the controls, leading to prolonged alveolar bone resorption. Higher levels of tooth movement, increased numbers of osteoclasts, increased expression of factors involved in osteoclast activity, and decreased expression of osteoblastic markers have been observed in T1D mice. However, to the best of our knowledge, the influence of T2D on orthodontic tooth movement has not yet been studied.
Considering the increasing demand for orthodontic treatment in adults, who are more likely to have T2D, it seems important to investigate the underlying biologic processes involved in orthodontic tooth movement. In this study, we investigated the bone remodeling process during orthodontic tooth movement in both normal and T2D animal models by histologic evaluation of the alveolar bone and determination of the gene expression levels of RANK, RANKL, and OPG in maxillary bone specimens.
Material and methods
This study was conducted on 24 male Wistar rats (314 ± 10 g, 13-14 weeks old), representing healthy controls, and 24 male GK rats (320 ± 9 g, 13-14 weeks old), which were used as the T2D animal model. In blood samples taken from the tail vein after overnight fasting, we measured the glucose levels using a glucose reagent strip and glucometer (Sensocard; 77 Elektronika Kft, Budapest, Hungary). The inclusion criterion for the GK rats was an increased blood glucose level of 150 mg per deciliter or greater after overnight fasting. Furthermore, to determine serum insulin, the blood samples were collected in sterilized tubes, left to fully coagulate (30-45 minutes), and centrifuged for 10 minutes at 4°C and at 1800 g. Serum insulin was measured by a chemiluminescent immunometric assay (Immulite 2000 XPi; Siemens, Erlangen, Germany).
All animal procedures and the study protocol were approved by the veterinary administration of the Republic of Slovenia (number 34401-62/2008/9) and were in accordance with the Guide for the Care and Use of Laboratory Animals.
The animals were divided into the following 4 groups: Wistar control group (n = 8), GK control group (n = 8), Wistar appliance group (n = 16), and GK appliance group (n = 16). In the Wistar and GK control groups, no orthodontic appliances were placed. The animals in the Wistar and GK appliance groups were fitted with orthodontic appliances.
The orthodontic appliance consisted of a superelastic closed-coil spring (25 cN, 0.15-mm wire diameter; Dentsply GAC International, York, Pa), which was placed with a stainless steel ligature between the maxillary left first and second molars and the incisors as previously described. The orthodontic appliance was placed in an animal under general anesthesia at the beginning of the study and replaced to the correct position every 7 days, ensuring its proper activation and the exertion of constant force on the teeth. To ensure general anesthesia, a mixture of ketamine (50 mg/kg of body weight; Bioketan; Vetoquinol Biowet, Gorzów Wielkopolski, Poland) and medetomidin hydrochloride (67 μg/kg of body weight; Domitorp; Pfizer, Brooklyn, NY) was injected intraperitoneally.
On day 42, all animals in all groups were killed, and the maxillary bones with the 3 molars were obtained. In the control groups, the maxillary left bones were prepared for histomorphometric analysis, and the right bones were used for the gene expression level determination. In the appliance groups, only the maxillary left bones, in which the appliances were fitted, were collected for histomorphometric (n = 8) and gene expression (n = 8) analyses.
The distance between the most mesial point of the maxillary left first molar and the most palatal point of the ipsilateral incisor at the gingival level was measured in all groups. Measurements were obtained weekly while the animals were anesthetized using a digitronic caliper with an accuracy of ±0.01 mm (Wilson & Wolpert, Utrecht, The Netherlands). All measurements were independently obtained twice by 2 investigators (A.P., Š.S.) within a few minutes. Tooth movement was calculated by subtracting the distance between the teeth on each day of measurement (days 0, 7, 14, 21, 28, 35, and 42) from the distance between the teeth measured the previous week.
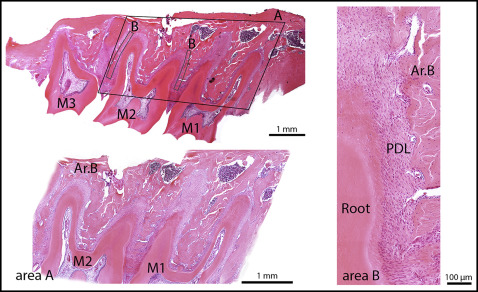
Tissue specimens were fixed with 4% paraformaldehyde in phosphate-buffered saline solution (pH, 7.2-7.4) at +4°C for 24 hours and decalcified in an ethylenediamine tetraacetic acid (EDTA)-water solution at +4°C for 12 days. Subsequently, the samples were dehydrated in ethanol (50%, 70%, 90%, and 100%) and xylol and were embedded in paraffin. The paraffin blocks were oriented so that the maxillae were cut perpendicular to the occlusal plane of the molars. Paraffin sections 7 μm thick were deparaffinized and stained with hematoxylin and eosin. Bone histomorphometry was used to determine the alveolar bone volume and osteoblast and osteoclast surfaces in all groups. Histomorphometry was performed using a point-counting method. For this purpose, a stereologic cycloid grid system, incorporated into the ocular of a light microscope (BX-60; Olympus, Tokyo, Japan), was used. The alveolar bone area was determined at 10-fold magnification and expressed as the percentage of alveolar bone area vs the tissue area; the tissue area consisted of tooth, periodontal ligament (PDL), connective tissue, and bone marrow spaces. To determine the alveolar bone area, the area consisting of the first and second molars with the surrounding tissue was examined. However, because 20 sections from each specimen were examined, the alveolar bone area could be extrapolated to alveolar bone volume. The osteoblast and osteoclast surfaces, defined as the alveolar bone surface area covered with osteoblasts or osteoclasts vs the alveolar bone surface area, were determined at 40-fold magnification. The cells were counted in the alveolar bone alongside the mesial and distal roots of the second molar ( Fig 1 ).
The maxillary bones with all 3 molars and their PDLs were excised and immediately frozen in liquid nitrogen. To prevent the degradation of RNA during sample collection, all the instruments used were sterilized. Furthermore, RNaseZap spray (Ambion, Grand Island, NY) was used on all surfaces and instruments in contact with the specimens, and the removal of soft tissues from the specimens was performed on glass plates placed on ice.
Bone specimens were mechanically powdered in liquid nitrogen using a mortar and pestle, ensuring that throughout the entire procedure the samples were deeply frozen. The total RNA was isolated from 120 ± 30 mg of each of the powdered samples. After sufficient powdering, each specimen was immediately transferred into a 1.5-mL tube containing 1 mL of Trizol (TRIzol Plus RNA Purification System; Life Technologies, Carlsbad, Calif) to prevent RNA degradation. This suspension was further homogenized using an ultrasound homogenizer to decrease the viscosity of the sample and increase cell membrane lysis, enhancing RNA release from the cells. Afterward, RNA was isolated using chloroform extraction and a PureLink RNA Mini Kit (Invitrogen, Carlsbad, Calif). To further prevent RNA degradation, RNaseZap reagent was used throughout the entire process. Isolated RNA was quantitatively and qualitatively assessed. The quality of the RNA was determined by 2 methods: spectrophotometrically with a NanoDrop ND-1000 Spectrophotometer (Thermo Scientific, Waltham, Mass), followed by capillary electrophoresis with a Bioanalyzer 2100 (Agilent Technologies, Santa Clara, Calif) for the detection of RNA degradation. The concentration of the RNA was measured spectrophotometrically using a NanoDrop ND-1000. Only the samples at suitable concentrations (greater than 100 ng/μL) and quality (RNA integration number higher than 5 as determined by the Bioanalyzer 2100) were used in our study.
To synthesize complementary DNA, 50 ng of total RNA was used with a Transcriptor High Fidelity complementary DNA synthesis kit and the addition of RNase inhibitor (Life Technologies). The reaction was conducted according to the manufacturer’s recommendations at a final volume of 50 μL. Predesigned assays (TaqMan Gene Expression Assays; Applied Biosystems, Grand Island, NY) were used for the RANKL (Rn00589289_mL) and OPG (Rn00563499_mL) gene expression measurements, along with the HOT FIREPol Probe quantitative polymerase chain reaction (qPCR) Mix Plus ROX master mix (Solis BioDyne, Tartu, Estonia), according to the master mix protocol specified by the manufacturer. For the RANK and glyceraldehyde 3-phosphate dehydrogenase (GAPDH) gene measurements, primers (forward RANK primer sequence 5′TTCGGAGCTCAACATCCCTTGC3′, reverse RANK primer sequence 5′ACATCTGAGAAGAAGCCCAGGAG3′; and forward GAPDH primer sequence 5′TGATTCTACCCACGGCAAGTT3′, reverse GAPDH primer sequence 5′TGATGGGTTTCCCATTGATGA3′) were designed using Primer BLAST (NCBI, Bethesda, Md) and quantified using HOT FIREPol EvaGreen qPCR Mix Plus ROX (Solis BioDyne), according to the manufacturers’ protocols. A standard curve was constructed from serial dilutions (4-0.125 ng/μL) of a mix of a few samples for each gene that was measured. All amplifications were performed in triplicate in 15-μL reactions on a LightCycler 480 (Roche, Grenzach-Wyhlen, Germany), and gene expression data were obtained using a standard curve and the second derivative maximum method (LightCycler 480 software, version 1.5.0; Roche). For RANK and GAPDH, melting curve analysis was also conducted to verify the specificity of the products. The gene expression data for RANK, RANKL, and OPG were normalized to the reference gene GAPDH according to the following equation: expression of the gene of interest measured in sample x/GAPDH expression measured in sample x.
Statistical analysis
The data are expressed as means ± standard errors, and they were calculated for each parameter for all animals in all 4 groups. Within-group and between-group comparisons were performed for alveolar bone volume, osteoblast surface, osteoclast surface, tooth movement, and gene expression levels of RANK, RANKL, and OPG using analysis of variance, followed by the Bonferroni multiple comparison test. A P value less than 0.05 was considered statistically significant. The interexaminer reliability for the measurements of the distance between the teeth for calculating the tooth movement and the intraexaminer reliability for the calculations of alveolar bone volume, osteoblast surface, and osteoclast surface were tested using the intraclass correlation coefficient (ICC).
Results
The average fasting blood glucose levels were 89.59 ± 6.59 mg per deciliter for the Wistar rats and 212.04 ± 9.18 mg per deciliter for the GK rats. The difference was significant ( P <0.001). The insulin level in the Wistar rats was below the detectable level with the method we used (2 mIU/L), whereas serum insulin was 5.2 ± 1.9 mIU per liter in the GK rats.
The physiologic distal drift of the molars was significantly more pronounced in the GK control group compared with the Wistar control group. However, in both appliance groups, the distances between the teeth decreased but were not significantly different between the groups ( Fig 2 ). The interexaminer ICC for the measurements of the distance between the teeth was 0.947.
Stay updated, free dental videos. Join our Telegram channel
VIDEdental - Online dental courses


