Introduction
The aims of this study were to analyze changes in bone density of the midpalatal suture after surgically assisted rapid palatal expansion (SARPE) with the bone-borne Dresden Distractor (DD; ITU, Dresden, Germany) via computed tomography (CT) and to compare of preoperative surgical findings with a control group.
Methods
Sixteen adult patients (mean age 24.5 years) underwent axial CT scans before and 7 months after SARPE. CT image fusion was performed for the midpalatal suture bone. Sixty-six controls (mean age 25.7 years) served for comparing age-related bone density. Bone structure and density were assessed in the coronal plane at the anterior, median, and posterior levels.
Results
Highest density was found in the posterior part (1046 Hounsfield units [HU]) before expansion. Seven months after SARPE, bone density was 48% (anterior), 53% (median), and 75% (posterior) compared with preoperative values. The control group showed fairly equal Hounsfield units (889 HU to 900 HU) in all parts.
Conclusions
Seven months after SARPE, the midpalatal suture’s density achieves just one half to three quarters of the pretreatment values. To maintain the resistance against forces from the unsplit posterior part, the retention time should be lengthened.
Rapid palatal expansion (RPE) has been used as an orthodontic treatment in cases of extreme maxillary transverse deficiency and crossbite for over 150 years. High forces are exerted on the midpalatal suture, leading to its separation and resulting in transverse expansion of the maxilla. The midpalatal suture is a unique suture. Masticatory function and hormonal, genetic, and mechanical parameters determine its maturity and structure. There is no correlation between completion of skeletal maturity and suture closure, and interindividual morphological variation is high.
Complications, treatment failure, and relapse after treatment become more frequent with the patient’s advancing age. One reason that has been suggested is that increasing mineralization of the midpalatal suture is accompanied by high resistance to expanding forces; some believe it to be the area of main resistance. Further investigations showed that the overall rigidity of the adjoining facial bony structures resists maxillary expansion with advancing age. Surgical intervention should therefore be considered when treating skeletally mature patients. The opened suture must have time to regenerate after expansion to achieve sufficient stability. The length of the retention period is controversial in the literature.
The aim of this study was to evaluate the midpalatal suture’s bone density in patients undergoing SARPE with the bone-borne Dresden Distractor (DD) using axial computed tomography (CT) scans before and 7 months after surgery. We also aimed to compare the preoperative findings with a control group.
Material and methods
Two groups were involved in this study. Patients with maxillary transverse deficiency and the need for RPE and a control group with normal occlusion. The first group numbered 16 subjects (7 male and 9 female) aged from 17.5 to 36.2 years (mean age 24.5 years) who underwent surgically assisted rapid palatal expansion (SARPE). Their maxillary transverse deficiency was combined with Class II or Class III malocclusion or open bite, which required orthognathic surgery. Expansion was surgically assisted using the method described by Glassman et al. As described in a pilot study by Tausche et al, the DD was inserted during this procedure. It is a bone-borne appliance with an implant on 1 side and a self-drilling osteosynthesis screw on the other. The implant and miniscrew were positioned between the roots of the second bicuspid and the first molar.
Two standard axial CT scans were taken of each patient for diagnostic purposes before (T1) and, on average, 7.01 months (SD 2.79) after (T2) SARPE with the bone-borne DD. The CTs were primarily taken for diagnostic and treatment planning purposes prior to orthognathic surgery and implant insertion, and secondarily for a 3D evaluation of the effects of the DD on skeletal structures and teeth.
All subjects were positioned with the occlusal plane perpendicular to the horizontal plane for CT scans. The scanning process was limited cranially by the orbital floor and caudally by the gnathion. Images were taken by a 16-Multislice computer tomograph (SOMATOM Sensation 16, Siemens, Forchheim, Germany) according to a standard protocol. After the examinations, image data were calculated in axial slices measuring 0.5 to 0.8 mm. The CT, image fusion and measurements were evaluated on workstations using the Syngo software program (Syngo VX49B, image fusion, Leonardo-Workstation VD 10B, Siemens AG, Forchheim, Germany).
Starting with a 3-day latency period, patients were instructed to turn the screw 4 times a day for 8 days (SD 2) with 29 quarter rotations (24 to 36) of 0.25-mm each. This led to an average screw expansion of 7.25 mm.
The DD was kept in situ for 3 to 6 months to allow bone mineralization. In contrast to our pilot project, in this study we followed different literature that proposed retention of 3 to 6 months. After the distractor’s removal, the implant was left in place and used for further retention and anchorage of an implant-borne transpalatal bar (TPB).
The control group consisted of 44 male and 22 female subjects from 15 to 39 years (mean age 25.7 years). Patients had undergone CT from 2005 to 2009 in our Department of Maxillofacial Surgery. The indication for the CT was a facial trauma beyond our region of interest. Moreover, the CT had been taken immediately after the trauma. Thus, we can exclude an effect on the midpalatal suture. The CT scan was taken at the same level of tube voltage that the SARPE group had been exposed to. We set our focus for selecting patients from a healthy population with normal occlusion within the same age limits as our study group. However, there were relatively fewer female subjects available, because at this age more men suffer facial trauma.
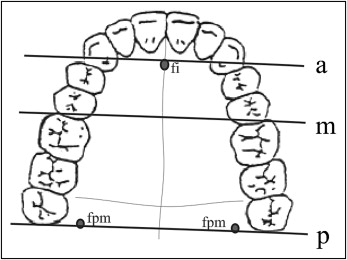
Bone density and transverse dimension of the midpalatal suture were acquired in 3 slices (anterior, median, posterior) in the coronal plane at T1 and T2 and in the control group. The sections were defined as being anterior by referring to the frontal margin of the foramen incisivum, median by the mesial edge of the first molar, and posterior by the foramen palatinum majus ( Fig 1 ). The median section was set at the same level as the implant and osteosynthesis screw, which is the area in which the DD distributes the greatest stress. All points were highly reproducible. The correct retrieval of sections at T1 (before SARPE) and T2 (after SARPE) was assisted via image fusion and the use of a divided window through measurements. Image fusion is a procedure for superimposing the pre- and postoperative CT scans of each patient in all 3 dimensions. We therefore used specific anatomical landmarks as described by Lagravere.
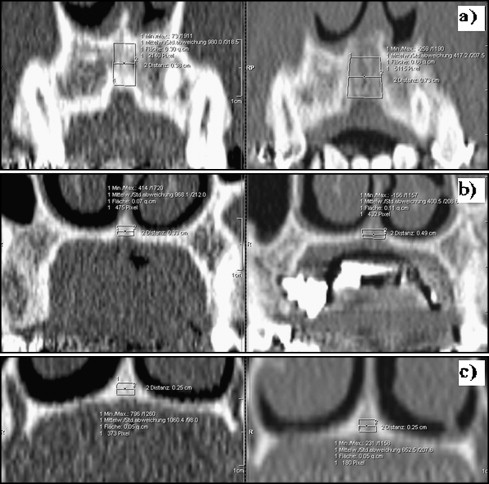
Density measurements were limited cranially by bony structures of the nasal cavity, caudally by the palatal vault, and laterally visually by the examiner through the differences in grayscale between suture and bone edge and demonstrated in Figure 2 .
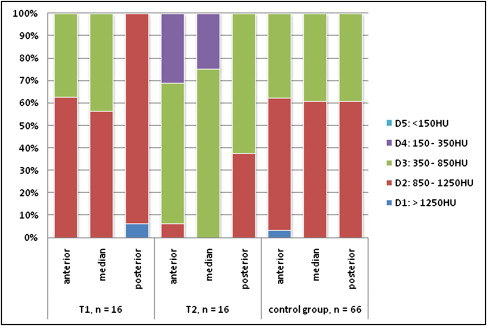
In all 3 defined sections, we measured the transverse width of the midpalatal suture and the Hounsfield units as a unit of bone density before and after expansion. The Misch bone density classification was applied to illustrate our results. The classification is divided into 5 degrees (D1: > 1250 HU; D2: 850 to 1250 HU; D3: 350 to 850 HU; D4: 150 to 350HU; D5: < 150 HU). Method of choice is evaluation by means of CT.
The data was analyzed using Microsoft Excel (Microsoft, Seattle, Wash). Each patient’s bone density values and suture widths were measured twice by the same examiner with a 7-day period in between. The kappa value was calculated as 0.99, and, according to the evaluation of Landis and Koch, revealed almost perfect agreement. This was done at T1 and T2 in all subjects undergoing SARPE. The control group contained only 1 CT per patient, which we considered to be T1 for comparison with the SARPE group. We calculated the mean values and SD for each group.
One examiner carried out all measurements of 1 section of a single patient 10 times pre- and postoperatively, so stochastic error could be determined and reproducibility demonstrated. The paired t test was applied to identify differences in the midpalatal suture’s width and bone density between T1 and T2. The unpaired t test was used to compare differences between both groups as well as those defined by sex and age, The Pearson correlation coefficient was used to investigate age-related preoperative bone density and expansion-related postoperative differences in bone density.
Results
Individual stochastic error was estimated to be 2.54% for bone density and 1.45% for the suture’s transverse width. Those values are highly significant ( P <0.01).
Group 1: patients undergoing SARPE
At T1, values ranged from 492 to 1314 HU. Patients presented the highest average density with 1046 HU in the posterior area. We observed 950 HU in the anterior and 845 HU in the median areas. Greatest transverse width was detected in the anterior (3.41 mm), decreasing dorsally (2.32 mm) ( Table I ).
| T1 (preexpansion) | T2 (postexpansion) | T2–T1 | P | |||||||||
|---|---|---|---|---|---|---|---|---|---|---|---|---|
| Mean | SD | Minimum | Maximum | Mean | SD | Minimum | Maximum | Absolute | Relative | |||
| Density (HU) | ||||||||||||
| anterior | 950 | 167 | 680 | 1218 | 459 | 174 | 250 | 856 | −491 | 48% | 0.000 | ∗∗ |
| median | 845 | 125 | 492 | 1035 | 452 | 162 | 196 | 749 | −393 | 53% | 0.000 | ∗∗ |
| posterior | 1046 | 103 | 865 | 1314 | 787 | 191 | 529 | 1245 | −260 | 75% | 0.000 | ∗∗ |
| Width (mm) | ||||||||||||
| anterior | 3.41 | 1.74 | 0.70 | 8.70 | 5.71 | 2.57 | 1.00 | 10.90 | 2.30 | 168% | 0.000 | ∗∗ |
| median | 2.79 | 1.55 | 0.80 | 6.60 | 3.90 | 2.08 | 0.95 | 8.50 | 1.12 | 140% | 0.000 | ∗∗ |
| posterior | 2.32 | 1.06 | 0.90 | 3.80 | 2.57 | 1.13 | 1.00 | 4.20 | 0.26 | 111% | 0.005 | ∗∗ |
We measured the midpalatal suture after the retention period (step 2). The second CT scan was taken 7.01 months (SD 2.79) after expansion. The highest density (mean 787 HU) was found in the posterior area. This corresponds to our findings at T1 ( Table I ). We measured 459 HU and 452 HU in the anterior and median regions. When the DD is extended, a V-shaped opening in the 2 halves of the maxilla is observed, which converged distally. The largest transverse width was 5.71 mm in the anterior, falling to 2.57 mm in the posterior area ( Table I ).
We observed highly significant lower bone density when comparing the data before and after SARPE ( P <0.01) in each section. In the anterior and median suture, the bone density decreased to 48% and 53%. This reduction was 491 HU in the anterior and 393 HU in the median region. Bone density fell to 75% of the baseline value in the posterior midpalatal suture.
Dispersion in Misch’s bone density classification showed an accumulation of more than 50% at T1 in all 3 sections in category D2 ( Fig 3 ). D1 was noted only once in the posterior portion of the suture. D4 and D5 were absent in all regions. After expansion, the distribution of all areas shifted to D3. The only area to reveal greater density (38%) was posterior; it had to be classified as D2.
No difference between sexes became apparent in either the preoperative or post-expansion examination. We observed no significant correlation between bone density at T2 and the amount of transverse expansion, nor were there any significant differences in relative bone density (T2/T1) when comparing patients whose second CT scans had been taken at different times.
Group 2: control group
Density ranged from 427 HU to 1294 HU. We measured the highest mean values in the anterior (900 HU), closely followed by 899 HU posterior, and 889 HU median. Transverse dimensions measured 2.31 mm (anterior), 2.09 mm (median), and 1.83 mm (posterior).
Applying the Misch bone density classification, we observed an accumulation of more than 59% for each region at D2. The highest D1 was noted only in the anterior, while D4 and D5 yielded no values ( Fig 3 ).
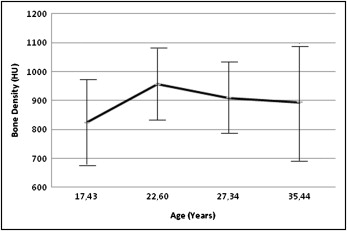
Additionally, we divided the controls into 4 age-related groups. There were at least 15 subjects at each stage. Mean values and SD were calculated for each group. This division revealed an obvious increase in density on all 3 planes between 15 and 25 years of age ( Fig 4 ). The highest values were assessed at a mean age of 22.6 years, with 1004 HU anterior, 924 HU median, and 939 HU posterior. Density decreased consistently with advancing age ( Fig 4 ). The lowest mean density in the adult population (882 HU) was apparent in the anterior area at an average age of 35.44 years. We noted no linear correlation between density and age, nor a significant sex correlation.
Comparison of both groups
We observed highly significant ( P <0.01) differences between the control and SARPE groups at T1 in the posterior density ( Table II ). Significant differences ( P <0.05) existed between the 2 groups in the anterior plane when comparing sutural width. No differences were present in other planes or according to sex. It was therefore possible to compare the 2 groups, since the posterior part of the suture is less influenced by the DD and different sutural widths are due to multiple factors.


