Introduction
The aim of this study was to determine the appropriate range of cortical bone thickness (CBT) for supporting an orthodontic microimplant.
Methods
Analysis of an orthodontic microimplant subjected to a horizontal force of 2N was performed using a nonlinear finite element method. The peak stresses in the cortical bone of 6 bone specimens (6 base models) with CBT of 0.5, 0.75, 1.0, 1.5, 2.0, and 3.0 mm, respectively, were analyzed. Assuming that the biomechanical effectiveness of cortical and cancellous bone is determined by the portion of the orthodontic force that each bone component takes up, we defined the ratios of the orthodontic force divided between the cortical and cancellous bone as load share ratios (LSR): ie, LSR cortical and LSR cancellous . Along with the base models, imaginary models created by removal of the cancellous bone from the base model bone specimens were analyzed in parallel; the imaginary models were designed so that the cortical bone alone took up all of the orthodontic force. By comparing the peak stresses in the imaginary and base models, the ratios of orthodontic force taken up by the cancellous and cortical bone (LSR cancellous and LSR cortical ) were calculated.
Results
The highest stress concentration occurred near the fulcrum where the orthodontic microimplant, undergoing tipping, presses the cortical bone surface in the direction of the force. Overall, the increase in CBT resulted in a decrease of the peak stress in the cortical bone. The decrease of stress, however, was not significant when the CBT was > 2.0 mm. LSR analysis showed that the cancellous bone has a substantial role in resisting the orthodontic force in cases of CBT ≤1.0 mm. Its role, however, declined rapidly with an increase of CBT and virtually disappeared at CBT values > 2.0 mm. LSR cortical was approximately 95% (LSR cancellous was 5%) at CBT = 1.5 mm and almost 100% at CBT = 2.0 mm, indicating that virtually all of the orthodontic force is transmitted to the cortical bone at CBT values of 2.0 mm or above. These results collectively demonstrated that CBT > 2.0 mm is biomechanically redundant.
Conclusions
From the biomechanical perspective, CBT values of 1.0 to 2.0 mm might be appropriate for orthodontic microimplant treatment.
The single most important factor for the success of an orthodontic microimplant (OMI) is bone. Without firm osseous support, stability and anchorage capacity of a skeletal anchorage device such as an OMI will hardly be possible. Cortical bone with adequate thickness appears to be particularly important. Biomechanical parameters of OMI-bone interactions, such as insertion torque and stress distribution, have been found to depend strongly on cortical bone thickness (CBT). Melsen and Verna and Dalstra et al demonstrated that the OMI to bone load transmission occurs primarily at the OMI-cortical bone interface, and that CBT determines the overall mechanism.
Many authors have already investigated the effects of CBT on the clinical success of the OMI. Nearly all of these studies have agreed that thin cortical bone has an adverse impact on the stability of the OMI. For example, Miyawaki et al observed that a high mandibular plane angle, which often exists with thin cortical bone, is associated with a lower OMI success rate. Motoyoshi et al, who reported similar results, suggested that CBT of 1.0 mm or less is a risk factor for OMI failure.
However, OMI stability does not appear to increase in proportion to the increase in CBT. A large CBT also did not guarantee higher success rates of OMIs. Despite the positive correlation between CBT and the primary stability of the OMI, and contrary to common intuition that thick cortical bones strengthen the secondary stability of the OMI by increasing bone-implant contact, many clinical studies have reported that OMIs placed in sites with thicker cortical bone had higher failure rates. Cheng et al observed that the failure rate was higher in the mandible, where the cortical bone is thick and dense, than in the maxilla. Tseng et al and Park et al reported the same results. These findings indicated that CBT values not only below a certain level, but also above, might be a disadvantage to the stability of the OMI.
Because of the increasing use of OMIs in orthodontic practice, it seems important to determine the appropriate CBT range that will maximize the chance of OMI success. Thus, in this study, we analyzed the functional effectiveness of CBT. Primary emphasis was placed on identification of the upper CBT bound (assuming that the lower bound is 1.0 mm, as suggested by the above-mentioned clinical studies ). Along with the peak stress in the cortical bone, we evaluated the ratios (percentages) of the orthodontic force taken up by the cortical and cancellous bone as diagnostic parameters.
Material and methods
A nonlinear finite element method (FEM) was used. In the FEM, a complex geometric shape is modeled as a mesh of simpler structures (finite elements), each having an appropriate material property. It is therefore well suited to parametric analyses, in which the effect of specific parameters, such as CBT, can be investigated in a controlled manner.
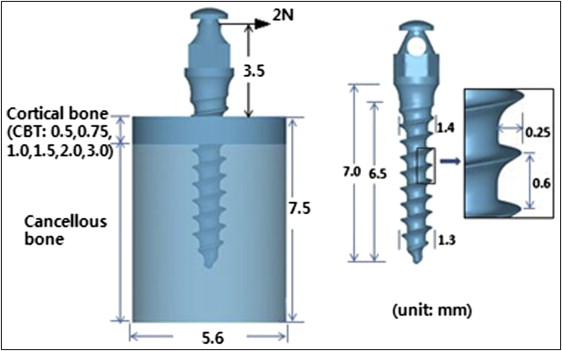
Three-dimensional computer-aided design models of the titanium-alloy based OMI (Absoanchor SH 1413-07; Dentos, Daegu, South Korea) and 6 bone specimens (6 base models) were generated. Their geometry and dimensions are shown in Figure 1 . Cylinder-shaped bone specimens had the same diameter and height (5.6 and 7.5 mm) but different CBT values. Based on published data on human jaw bone structure, CBT values were set at 0.5, 0.75, 1.0, 1.5, 2.0, and 3.0 mm.
The OMI and each of the 6 bone models imported into the FEM software (DEFORM version 6.1; Scientific Forming Technologies, Columbus, Ohio) were meshed using 3-dimensional tetrahedron elements with 4 nodes. To achieve mesh consistency among the models and thus prevent errors, the cortical and cancellous bone of all models was meshed with the same degree of density. Particular care was taken to ensure that the complex geometry of the OMI threads and the interfacial bones maintained their original shapes without significant distortion caused by meshing errors. For this, much finer mesh was used for the OMI itself as well as the bone within 0.5 mm from the OMI where the biomechanical interactions between the two mainly occur. An orthodontic force of 2N was applied to the OMI head in a horizontal direction. All nodes on the circumferential wall of the bone specimens were clamped as geometric boundary conditions. Although not described here, a convergence analysis was performed that ensured that sufficient elements had been specified in creating the mesh models.
In reference to previous studies, homogeneity, isotropy, and linear elasticity were assumed for both the OMI and bone (material properties used are shown in the Table ). However, for realistic representation of the nonosseointegrated interface between the OMI and bone, “friction-contact” conditions with nonlinear characteristics were used instead of the usual “fixed bond.” Under friction-contact conditions, the OMI-bone interfaces transfer pressure and tangential force but not tension. FEM analyses of dental implants have shown remarkable differences in the values and the distribution of stresses obtained under “friction-contact” and “fixed-bond” interface conditions. Based on previous studies, a friction coefficient of 0.3 was assigned between the OMI and either the cortical or the cancellous bone. Assuming that bone is free of any prestress, the analysis was performed with the aim of evaluating the peak stresses in the cortical bone.
| Young’s modulus (GPa) | Poisson’s ratio | Threshold stress (MPa) | Ultimate strength (MPa) | |
|---|---|---|---|---|
| Cortical bone | 13.7 | 0.3 | 54.8 ∗ | 198.2 |
| Cancellous bone | 1.37 | 0.3 | ||
| Titanium alloy (ASTM grade 23) | 113.4 | 0.342 |
∗ Threshold stress is equivalent to −4,000 μ-strains, which has been described as the threshold for triggering pathologic resorption of human cortical bone.
The biomechanical effect of CBT was assessed based on the evaluation of 2 parameters: the peak stress in the cortical bone, and the portion of orthodontic force taken up by the cortical bone.
With the tipping of the OMI caused by the horizontally acting orthodontic force on its head, the highest stresses are expected to occur at the fulcrum (Point A in Fig 2 , C ), where the OMI presses the cortical bone surface in the direction of force. Therefore, the radial stress, a stress component that develops as a direct consequence of the pressure that the OMI exerts on the bone, was selected for stress assessment. The peak compressive radial stress in the cortical bone, occurring at Point A, was calculated for each of the 6 base models.
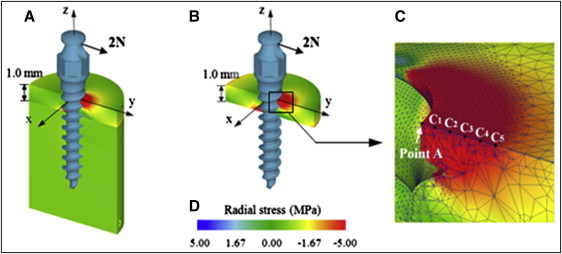
To avoid singularity problems that can occur when analyzing stresses near sharp corners, such as Point A, the peak stress was estimated using a regression analysis, instead of quoting the nodal stress at this point directly from the FEM results. The stresses obtained at the 5 reference points (5 nodes were set on the cortical bone surface away from Point A by 0.1, 0.2, 0.3, 0.4, and 0.5 mm: points C1, C2, C3, C4, and C5 in Fig 2 , C ) were used to build a quadratic regression function. The peak stress was then calculated asymptotically using SPSS software (version 21; IBM, Armonk, NY). As will be shown later, stress values recorded on all 5 reference points showed a continuous pattern, without abrupt changes; this is an important prerequisite for reliable regression estimation.
Although the orthodontic force is resisted by both the cortical and cancellous bone, the portion of the orthodontic force taken up by the cortical bone is assumed to determine its biomechanical (or functional) effectiveness. The ratios of the orthodontic force divided between and resisted by the cortical and cancellous bone, respectively, were defined as load share ratios (LSR): LSR cortical and LSR cancellous . Their calculations were performed as follows for each CBT case.
-
Step 1: Analyze a base model where the OMI is supported by both cortical and cancellous bone as normal and evaluate peak stress (PS base ).
-
Step 2: Create an imaginary model by removing the cancellous bone from the base model and evaluate PS imaginary . In this model, all of the orthodontic force is resisted by the cortical bone alone so that PS imaginary is greater than PS base .
-
Step 3: Calculate the difference in the peak stresses of the base and imaginary models: ie, ΔPS = PS imaginary − PS base .
ΔPS is the increment in the peak stress in the cortical bone as the cortical bone is made to resist the additional force previously taken up by the cancellous bone. In other words, ΔPS reflects the portion of the orthodontic force resisted by the cancellous bone in the base model. From this, we defined LSR cancellous as the following.
LSR cancellous = Force taken up by cancellous bone Total orthodontic force ( = 2 N ) ≒ ΔPS PS
Stay updated, free dental videos. Join our Telegram channel
VIDEdental - Online dental courses


