Introduction
The purpose of this study was to evaluate the hypothesis that 3-dimensional mandibular morphology is correlated with condylar movement in patients with mandibular asymmetry.
Methods
Subjects were classified into 2 groups (n = 25 each): mandibular asymmetry with a menton deviation greater than 4 mm and no mandibular asymmetry with a menton deviation less than 4 mm. Linear and volumetric measurements of 3-dimensional mandibular morphology were recorded using computed tomography. Mandibular functional movement was recorded by computerized axiography (CADIAX; Gamma Dental, Klosterneuburg, Austria), and condylar path length, sagittal condylar inclination, and transverse condylar inclination on protrusion were measured. We calculated side-to-side asymmetry (shifted side vs nonshifted side) in mandibular morphology and assessed condylar movement by using an asymmetry ratio (nonshifted side/shifted side).
Results
Significant differences in mandibular morphology and condylar movement were found between the 2 groups. In the group with menton deviation greater than 4 mm, significant correlations were found between the asymmetry ratio of mandibular morphology and condylar movement: ie, condylar path length and transverse condylar inclination. No significant correlations were found between any of these measurements in the group with menton deviation less than 4 mm.
Conclusions
In support of our hypothesis, the results suggested that 3-dimensional mandibular morphologic asymmetry is associated with condylar movement in subjects with mandibular asymmetry.
Highlights
- •
We evaluated the relationship between 3D mandibular morphology and condylar movement.
- •
In mandibular asymmetry, asymmetries in condylar movement and mandibular volume were observed.
- •
The 3D morphologic asymmetry is closely related to functional asymmetry.
Many researchers have investigated the craniofacial morphology of skeletal asymmetry using various methods involving 2-dimensional (2D) measurements and have also noted asymmetry in the dental arch, temporomandibular joint (TMJ), and intraoral pressure.
Skeletal asymmetry is also known to affect the symmetry of the condylar path, and previous studies have reported a relationship between condylar movement and facial morphology using posteroanterior cephalograms. Pirttiniemi et al found that the condyle path was steeper on the side of the crossbite in patients with unilateral crossbite. Hashimoto et al reported that the condylar path length during protrusive movements was significantly longer on the shifted side than on the nonshifted side, and noted a positive correlation between mandibular deviation and condylar path asymmetry in patients with facial asymmetry. Ishizaki et al reported that the transverse condylar inclination of the shifted side during protrusive movements showed negative values: ie, the condyle of the shifted side had a tendency to move outward and was significantly different from the nonshifted side.
However, 2D cephalometric analysis has several limitations, including errors caused by head posture, magnification, and distortion. To resolve these limitations, 3-dimensional (3D) computed tomographic (CT) analysis of facial morphology has been undertaken recently. Unlike 2D analysis, 3D analysis takes into account the surface area and volume. Takada et al suggested that morphologic study using 2D image analysis had limited accuracy and reliability, and advocated investigating serial mandibular movement and the interaction of detailed morphologic and functional aspects using 3D image analysis with its superior accuracy and reliability.
Few studies have investigated the correlation between 3D facial morphology and mandibular movement during maximum mouth opening and closing in subjects with orofacial deformities using the 3D computed tomography and optical tracking camera system. There are also no reports relating to simultaneous analysis of volumetric measurement and mandibular movement. Therefore, in this study, we sought to evaluate the hypothesis that 3D mandibular morphology is correlated with condylar movement in subjects with mandibular asymmetry.
Material and methods
Fifty adult subjects excluding those with skeletal Class II malocclusion participated in this study, after giving fully informed consent as stipulated in the protocol approved by the institutional ethics committee (approval 731) of Tokyo Medical and Dental University in Japan. The subjects were divided into 2 groups: mandibular asymmetry with a menton deviation greater than 4 mm (MA; n = 25; 14 women, 11 men; age, 25.7 ± 6.3 years) and no mandibular asymmetry with a menton deviation less than 4 mm (NA; n = 25; 14 women, 11 men; age, 21.7 ± 4.6 years). All subjects had a full permanent dentition except for the third molars. Subjects with congenital malformations including clefting, fracture, rheumatoid arthritis, trismus, and TMJ pain and those who were taking any medication known to affect muscle activity or who had undergone orthodontic treatment were excluded from the study. Patient characteristics in the NA and MA groups are listed in Table I . Additionally, the incidence of TMJ disorder symptoms is given in Table II .
| Variable | Mean | SD | Minimum | Maximum |
|---|---|---|---|---|
| NA group | ||||
| Age (y) | 21.7 | 4.6 | 16.5 | 34 |
| ANB (°) | −4.1 | 2 | −8.5 | 0 |
| MD (mm) | 1.3 | 1.1 | 0.1 | 3.5 |
| MA group | ||||
| Age (y) | 25.7 | 6.3 | 17.6 | 42.1 |
| ANB (°) | −1.3 | 2.8 | −7.5 | 2 |
| MD (mm) | 9.7 | 4.1 | 4.1 | 16.4 |
| NA group | MA group | |
|---|---|---|
| Only on the shifted side | 2 (8.0%) | 5 (25.0%) |
| Only on the nonshifted side | 5 (25.0%) | 9 (36.0%) |
| On the bilateral side | 2 (8.0%) | 7 (28.0%) |
| Total | 9 (36.0%) | 21 (84.0%) |
Three-dimensional facial morphology was measured using 3D CT scans taken using a multisliced CT unit (SOMATOM PLUS-S; Siemens Japan, Tokyo, Japan) at 120 kV and 200 mA. The thickness of the axial image was 3.0 mm, and the table speed was 4 mm per second. The spiral CT images that we used were not taken for research purposes. Although orthodontists use lateral and posteroanterior cephalometric radiographs as routine diagnostic records for orthognathic treatment, oral surgeons took the CT images of some patients with jaw deformities; this was necessary for planning their surgeries. Therefore, from the patients with these spiral CT images, we selected those who fulfilled the criteria for this study, and their scans were used secondarily for this research.
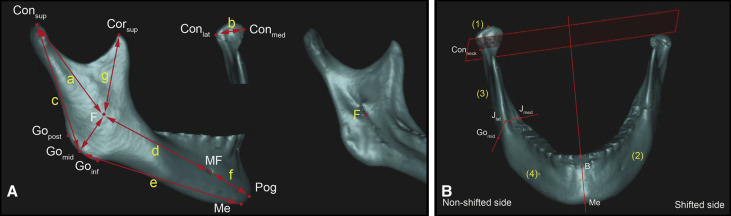
Digital imaging and communication in medicine (DICOM) data were reconstructed into 3D images using Simplant OMS (Materialise Dental Japan, Tokyo, Japan). Mandibular asymmetry was defined by the distance of menton deviation from the midsagittal reference plane. The midsagittal reference plane was defined with the method recommended by Suzuki-Okamura et al. The mandibles were separated from the whole images, and the teeth above the alveolar bone in the mandibles were removed. Landmarks and measurements were defined using the method of You et al. Condyle volume was defined as the structure superior to the plane that is perpendicularly intersected with the line connecting the apex of the condyle and the most inferior point of the mandibular foramen and that goes through the most depressed point of the neck of the mandible ( Table III ; Fig 1 ).
| Landmark | Definition |
|---|---|
| Con sup (condylion superius) | The most superior point of the condylar head |
| Con med (condylion medialis) | The most medial point of the condylar head |
| Con lat (condylion lateralis) | The most lateral point of the condylar head |
| Cor sup (coronoid superius) | The most superior point of the coronoid process |
| F (fossa of mandibular foramen) | The most inferior point on the fossa of the mandibular foramen |
| J lat | The most lateral and deepest point of the curvature formed at the junction of the mandibular ramus and body |
| J med | The most medial and deepest point of the curvature formed at the junction of the mandibular ramus and body |
| Go post (gonion posterius) | The most posterior point on the mandibular angle |
| Go mid (gonion midpoint) | The midpoint between Go post and Go inf on the mandibular angle |
| Go inf (gonion inferius) | The most inferior point on the mandibular angle |
| MF (mental foramen) | The entrance of the mental foramen |
| Me (menton) | The most inferior midpoint on the symphysis |
| Pog (pogonion) | The most anterior midpoint on the symphysis |
| B (supramentale) | The midpoint of the greatest concavity on the anterior border of the symphysis |
| G (genial tubercle) | The midpoint of the genial tubercle |
| Con neck | The most depressed point of the neck of the mandible |
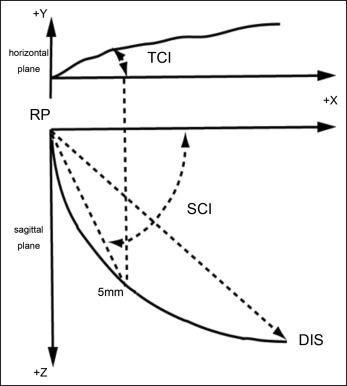
Mandibular functional movement was recorded by computerized axiography (CADIAX; Gamma Dental, Klosterneuburg, Austria) to measure condylar path length, sagittal condylar inclination on the sagittal plane, and transverse condylar inclination on the horizontal plane during protrusion. Each patient carried out voluntary protrusive movements with the teeth in contact. The condylar path length was measured as the shortest distance between the reference point and the most translated position of the condyle in the sagittal plane. Both sagittal condylar inclination on the sagittal plane and transverse condylar inclination on the horizontal plane were measured 5 mm from a reference point ( Fig 2 ).
The side toward which the chin was shifted was called the shifted side, and the other side was called the nonshifted side. We calculated side-to-side asymmetry (shifted side vs nonshifted side) in mandibular morphology and condylar movement in the NA and MA groups. Based on the results from a previous analysis to detect morphologic differences between groups, we also compared both the shifted side and the nonshifted side in the MA group (n = 25 each) with the mean values of the 2 sides of the NA group (n = 25). Moreover, to eliminate the influence of differences in the sizes of individual faces and to focus on the extent of intersubject asymmetry, we assessed mandibular morphology and condylar movement by using an asymmetry ratio (nonshifted side/shifted side). The condyles had a tendency to move toward the shifted side; this was reflected in the negative values of transverse condylar inclination.
Mandibular functional movements were measured by the same investigator (M.I.) to exclude interexaminer error. This investigator calculated each parameter manually using ImageJ software (version 1.45; National Institutes of Health, Bethesda, Md).
The method error for each parameter was calculated at an interval of at least 2 weeks. Errors for a single measurement of linear and volumetric variables were calculated with the formula developed by Dahlberg :
where d indicates the difference between measured pairs, and n indicates the number of pairs.
Statistical analysis
The Wilcoxon t test was used to compare measurements between the shifted and nonshifted sides, and the Mann-Whitney U test was used to compare measurements between the MA and NA groups. The Spearman rank correlation coefficient was used for correlations between 3D mandibular morphology and condylar movement. All procedures were performed with commercial statistical software (version 10.0; SPSS, Chicago, Ill). A threshold of P <0.05 was considered to be statistically significant.
Results
Among the 3D morphology results, overall measurement errors ranged from 0.30 to 0.95 mm for linear measurements, and from 39.06 to 128.75 mm 3 for volumetric measurements. When compared with previous studies (You et al, Kim et al ), no systematic errors were found.
The mean values and standard deviations of the 3D morphologic measurements on the shifted and nonshifted sides in the 50 patients are shown in Table IV .
| Measurement | NA group | P value | MA group | P value | ||||||
|---|---|---|---|---|---|---|---|---|---|---|
| Shifted side | Nonshifted side | Shifted side | Nonshifted side | |||||||
| Mean | SD | Mean | SD | Mean | SD | Mean | SD | |||
| Condylar unit length (mm) | 49.13 | 4.47 | 49.01 | 4.07 | 0.600 | 45.65 | 5.62 | 49.76 | 4.12 | 0.000 † |
| Body unit length (mm) | 60.74 | 5.00 | 61.3 | 5.02 | 0.085 | 57.07 | 4.85 | 60.56 | 5.16 | 0.004 † |
| Coronoid unit length (mm) | 41.08 | 5.29 | 40.45 | 4.40 | 0.052 | 40.02 | 4.43 | 38.35 | 4.48 | 0.197 |
| Angular unit length (mm) | 19.59 | 3.40 | 19.42 | 2.55 | 1.809 | 19.45 | 3.09 | 19.17 | 2.74 | 0.764 |
| Chin unit length (mm) | 32.00 | 2.32 | 32.13 | 2.06 | 1.044 | 31.12 | 2.07 | 32.29 | 2.82 | 0.049 ∗ |
| Condylar width (mm) | 20.16 | 2.82 | 20.37 | 2.80 | 0.591 | 17.99 | 2.86 | 19.17 | 2.62 | 0.049 ∗ |
| Ramal height (mm) | 46.61 | 4.86 | 45.66 | 4.52 | 0.214 | 43.59 | 5.83 | 46.49 | 4.78 | 0.001 † |
| Body length (mm) | 90.60 | 4.92 | 91.68 | 5.74 | 0.058 | 88.91 | 4.77 | 92.6 | 4.68 | 0.001 † |
| Condylar volume (×10 3 mm 3 ) | 1717.63 | 462.60 | 1740.55 | 424.51 | 0.659 | 1196.02 | 439.15 | 1589.71 | 380.94 | 0.000 † |
| Hemimandibular volume (×10 3 mm 3 ) | 31633.95 | 5903.75 | 31821.4 | 6605.05 | 0.639 | 29656.53 | 6517.21 | 31419.83 | 6340.97 | 0.015 ∗ |
| Ramal volume (×10 3 mm 3 ) | 9167.63 | 1867.36 | 9098.56 | 19991.21 | 1.426 | 7798.02 | 1773.63 | 8524.61 | 1858.87 | 0.004 † |
| Body volume (×10 3 mm 3 ) | 22438.63 | 4437.77 | 22536.24 | 4695.37 | 0.679 | 22216.41 | 4590.97 | 22836.1 | 4915.63 | 0.073 |
The NA group showed no significant differences in the 3D mandibular morphologic measurements between the shifted and nonshifted sides. By contrast, in the MA group, condylar unit length ( P <0.01), body unit length ( P <0.01), chin unit length ( P <0.05), condylar width ( P <0.05), ramal height ( P <0.01), body length ( P <0.05), condylar unit volume ( P <0.01), hemimandibular volume ( P <0.01), and ramal volume ( P <0.01) were significantly smaller on the shifted side than on the nonshifted side.
The means and standard deviations of the morphologic measurements on both shifted and nonshifted sides in the MA group (n = 25) and the mean values of the 2 sides of the NA group (n = 25) are shown in Table V .
| Measurement | NA group | MA group | P value | |||||
|---|---|---|---|---|---|---|---|---|
| Mean values of the 2 sides | Shifted side | P value | Nonshifted side | |||||
| Mean | SD | Mean | SD | Mean | SD | |||
| Condylar unit length (mm) | 49.07 | 4.05 | 45.65 | 5.62 | 0.029 ∗ | 49.76 | 4.12 | 0.479 |
| Body unit length (mm) | 61.02 | 4.81 | 57.07 | 4.85 | 0.013 ∗ | 60.56 | 5.16 | 0.734 |
| Coronoid unit length (mm) | 40.77 | 4.72 | 40.02 | 4.43 | 0.793 | 38.35 | 4.48 | 0.128 |
| Angular unit length (mm) | 19.51 | 2.79 | 19.45 | 3.09 | 0.907 | 19.17 | 2.74 | 0.580 |
| Chin unit length (mm) | 32.07 | 1.96 | 31.12 | 2.07 | 0.074 | 32.29 | 2.82 | 0.869 |
| Condylar width (mm) | 20.26 | 2.61 | 17.99 | 2.86 | 0.005 † | 19.17 | 2.62 | 0.143 |
| Ramal height (mm) | 46.14 | 4.45 | 43.59 | 5.83 | 0.032 ∗ | 46.49 | 4.78 | 0.823 |
| Body length (mm) | 91.14 | 5.20 | 88.91 | 4.77 | 0.160 | 92.6 | 4.68 | 0.308 |
| Condylar volume (×10 3 mm 3 ) | 1729.09 | 430.92 | 1196.02 | 439.15 | <0.001 † | 1589.71 | 380.94 | 0.240 |
| Hemimandibular volume (×10 3 mm 3 ) | 31727.67 | 6213.79 | 29656.53 | 6517.21 | 0.367 | 31419.83 | 6340.97 | 0.915 |
| Ramal volume (×10 3 mm 3 ) | 9133.10 | 1876.93 | 7798.02 | 1773.63 | 0.020 ∗ | 8524.61 | 1858.87 | 0.211 |
| Body volume (×10 3 mm 3 ) | 22487.44 | 4544.92 | 22216.41 | 4590.97 | 0.946 | 22836.1 | 4915.63 | 0.854 |
Stay updated, free dental videos. Join our Telegram channel
VIDEdental - Online dental courses


