Introduction
Precise diagnosis and treatment of facial asymmetry are important in orthodontics. The aims of this study were to determine the soft-tissue characteristics of patients perceived to have severe asymmetry requiring treatment and the soft-tissue factors affecting the subjective assessment of facial asymmetry.
Methods
In the first part of this study, 5 observers examined 1000 photographs of patients receiving orthodontic treatment and selected 100 for further assessment. These photographs showed 50 patients who were considered to have little or moderate asymmetry and 50 who were considered to have severe asymmetry. A pilot study was performed to select the reference photographs representing the most symmetric (score of 0) and the most asymmetric (score of 100). A panel of 9 orthodontists then rated the facial asymmetry of the 100 patients on a 100-mm visual analog scale. The scale was divided into 3 equal regions. Region 1 included patients with the least facial asymmetry; according to the orthodontists, these patients did not require treatment. Region 2 included patients with moderate facial asymmetry who did not require treatment. Region 3 included patients with the most facial asymmetry who did require treatment.
Results
One-way analysis of variance showed that lip canting, chin deviation, body inclination difference, and gonial angle difference had significant differences between the groups. Chin deviation and gonial angle difference were significant factors affecting the assessment of facial asymmetry, according to stepwise linear regression analysis.
Conclusions
These results will help in the diagnosis and treatment planning for patients with asymmetry.
About 80% of adults who seek orthodontic treatment want to improve facial aspects that are not associated with structural or functional problems. Patients who do not perceive their facial asymmetry in the early stage of orthodontic treatment might begin to recognize it as treatment progresses. De Smit and Dermaut and Foster reported that faces with ideal proportions and symmetry are not beautiful. On the other hand, they reported that abnormal proportions and asymmetric faces have unfavorable aspects.
The correction of facial asymmetry is becoming an important goal of orthodontic treatment and orthognathic surgery. It has been reported that all patients have some craniofacial asymmetry, including those perceived as normal. Ferrario et al found variable degrees of soft-tissue facial asymmetry in healthy white dental students with normal dentition. Therefore, it is widely recognized that facial asymmetry is often present in the normal craniofacial complex. In addition, it was reported that an occlusal cant of 0° to 3° has been observed in normal, healthy patients.
There is no invisible demarcation line, or even a range, marking the distinction between normal and abnormal asymmetry in terms of soft-tissue characteristics. A demarcation line determining the necessity of orthognathic surgery for facial asymmetry is also unknown. The borderline between normal and abnormal asymmetry might be determined by subjective evaluation such as the patient’s, or the orthodontist’s, perception of facial asymmetry.
Although cephalometric measurements address skeletal symmetry, subjective evaluations, such as the perception of facial asymmetry, might be based on soft-tissue features, including the outline of the face. Robinson et al reported that a beautiful face should be harmonious with comparable size and position of the skeletal structures and soft tissues. They stated that a favorable face can be shown by the soft tissues.
A diagnosis of facial asymmetry is normally made based on the measurements from a posteroanterior cephalogram or 3-dimensional (3D) skeletal computed tomography (CT) images by a clinician. However, the patient’s decision for treatment or satisfaction with the result is subjective and can be assessed by a perceptive assessment. There is a gap between the patient and the clinician in terms of the assessment of facial asymmetry. Therefore, the first assessable tool for patients with facial asymmetry must be the soft tissues.
There has only been 1 study on the correlation between the perception of facial asymmetry and the cephalometric measurements, and no reports of the relationship between the perception of facial asymmetry and the soft-tissue measurements.
The aims of this study were to survey the facial frontal photographs by subjectively evaluating facial asymmetry with a visual analog scale (VAS) and to determine the differences in soft-tissue measurements between the groups. The next steps were to determine the soft-tissue characteristics of patients perceived as having severe asymmetry and the borderline of abnormal asymmetry. Finally, the factors affecting the severity of the subjective assessment of facial asymmetry were determined. This study should help clinicians make a differential diagnosis of asymmetric patients and develop an appropriate treatment plan.
Material and methods
Five observers screened 1000 standardized facial frontal photographs and selected 50 with little or no facial asymmetry and another 50 with moderate or severe facial asymmetry. The inclusion criteria were as follows: over 18 years of age, no congenital abnormalities in the maxillofacial region, no prior surgery for an injury involving the maxilla or the mandible, and standardized facial photographs taken before treatment with sufficient quality for evaluation.
The final sample consisted of photographs of 61 women and 39 men (ages, 18.0-30.1 years; mean, 25.1 years). The photographs had been taken with a digital camera (350D, Canon, Seoul, Koea) with a distance of 1.5 m between the patient and the focus. The patients were seated upright on a special chair, with the Frankfort plane parallel to the floor. The patients looked directly at the camera lens. Both ears were exposed, and the right and left distances between the exocanthus and the hairline were the same. The patients were in occlusal rest postion.
The color photographs were printed individually on size A4 paper. The printed photographs were used to measure several soft-tissue measurements.
Five orthodontists in the Department of Orthodontics, Dankook University, Cheonan, Korea, selected the 5 most symmetric facial photographs and the 5 most asymmetric facial photographs. The photographs selected most frequently were called the reference photographs to represent the most symmetric and the most asymmetric faces; they were assigned scores of 0 and 100.
A panel of 9 orthodontists from the Department of Orthodontics, Dankook University, were asked to judge the 100 frontal photographs. The photographs were presented for 1 minute each, in random order. The orthodontists rated the facial asymmetry on a 100-mm VAS, marked “most symmetric” (0) on the left and “most asymmetric” (100) on the right. A 100-mm ruler was divided into 3 equal regions, and the meaning of the regions was explained to the panel. Region 1 included patients with little or no facial asymmetry and not requiring treatment. Region 2 included patients with moderate facial asymmetry but still not requiring treatment. Region 3 included patients with the most facial asymmetry who required treatment. All assessments were subjective.
During the session, the 2 reference slides representing 0 and 100 on the VAS were projected continuously. The panel was told of these set scores. The assessments were repeated twice with 2 weeks between sessions.
When each judge had finished, the 100-mm VAS values were measured to the nearest 0.1 mm by using a caliper and recorded on a data sheet. The raw data were entered in an Excel spreadsheet (Microsoft, Redmond, Wash).
The 9 assessment scores of each patient were averaged. The average scores from first and second sessions of each patient were compared by using the Student t test. The difference between assessments was not significant. Therefore, the second-session scores were used.
The patients were classified into 3 groups according to the average assessment scores in the previously fixed regions. Group I patients had scores of 0 to 33.3, group II patients had scores of 33.4 to 66.7, and group III patients had scores of 66.8 to 100. The printed frontal photographs were measured to analyze the soft-tissue characteristics of each group.
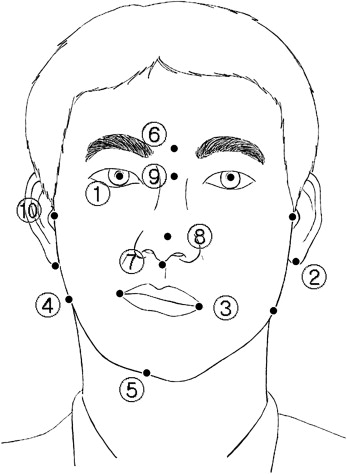
The soft-tissue landmarks used in this study are described in Table I and Figure 1 . Most points used in this study were proposed by Farkas.
| Landmark | Definition |
|---|---|
| Pp (pupil) | The apparently black circular opening in the center of the iris of the eye |
| G (glabella) | The most forward projecting point of the forehead in the midline of the supraorbital ridges |
| Ná (soft-tissue nasion) | The middle point of the soft-tissue frontonasal suture |
| O (otobasion inferius) | The inferior insertion of the ear |
| Sn (subnasale) | The point at which the columella merges with the upper lip in the midsagittal plane |
| Pr (pronasale) | The middle point of the outline of the nose tip |
| Ch (cheilion) | The most lateral extent of the outline of the lips |
| Mé (soft-tissue menton) | The most inferior point of the soft-tissue outline on the chin |
| Gó (soft-tissue gonion) | The most everted point of the soft-tissue outline of the angle of the mandible |
| Pre (preaureculare) | The most lateral point of the soft-tissue facial outline in front of tragus |
| Zero point | The intersection of midsagittal line and horizontal line |
The midsagittal reference line was defined as the line from glabella to subnasale. The horizontal reference line was the line perpendicular to the midsagittal line passing through the midpoint of both pupils. Ten lines, except for the midsagittal and horizontal reference lines, were established. These lines were used for the angular measurements. These were the bipupillary line, otobasion inferius line, lip line, gonion line, pronasale line, chin line, ramus line (right and left), and mandibular body line (right and left) ( Table II ).
| Reference line | Definition |
|---|---|
| Midsagittal line | G-Sn |
| Horizontal line | Perpendicular to midsagittal line passing through the midsagittal line |
| Bipupillary line | Right Pp-left Pp |
| Otobasion inferius line | Right O-left O |
| Lip line | Right Ch-left Ch |
| Gonion line | Right Gó-left Gó |
| Pronasale line | Ná-Pr |
| Chin line | Zero point-Mé |
| Ramus line (right and left) | Pre-Gó (right and left) |
| Mandibular body line (right and left) | Gó (right and left)-Mé |
Nine angular and 2 linear measurements were made. The angular measurements were eye canting, otobasion canting, lip canting, gonion canting, nose deviation, chin deviation, ramal inclination difference, body inclination difference, and gonial angle difference. Table III givess the definitions of these measurements. Eye canting, otobasion canting, lip canting, and gonion canting were measured by using the horizontal reference line. Nose deviation, chin deviation, ramal inclination, and body inclination were measured by using the midsagittal reference line. The ramal inclination difference, body inclination difference, and gonial angle difference were measured to calculate the difference between the right and left angles. All angular measurements were used as absolute quantities.
| Measurement | Definition |
|---|---|
| Eye canting (°) | ∠Horizontal reference line-bipupillary line |
| Otobasion canting (°) | ∠Horizontal reference line-otobasion inferius |
| Lip canting (°) | ∠Horizontal reference line-lip line |
| Gonion canting (°) | ∠Horizontal reference line-gonion line |
| Nose deviation (°) | ∠Midsagittal reference line-pronasale line |
| Chin deviation (°) | ∠Midsagittal reference line-chin line |
| Ramus inclination difference (°) | The difference of right and left ∠midsagittal reference line-ramus line |
| Body inclination difference (°) | The difference of right and left ∠midsagittal reference line-mandibular body line |
| Gonial angle difference (°) | The difference of right and left ∠Pre-Gó-Mé |
| Asymmetry index for horizontal Gó (%) | The ratio of right and left horizontal Go’ length |
| Asymmetry index for vertical Gó (%) | The ratio of right and left vertical Gó length |
Statistical analysis
The linear measurements were calculated by using the asymmetry index ( Table III ). Each distance for right and left soft-tissue gonion (Gó) was measured from the midsagittal and horizontal reference planes, respectively. The asymmetry indexes were calculated with the following formula:
where R is the value of the right distance, L is the value of the left, and M is the average of the right and left values.
The distance for Gó from the midsagittal plane was defined as the horizontal Gó value. The distance from the horizontal plane was defined as the vertical Gó value. Therefore, there were 2 types of asymmetry indexes: for horizontal Gó and vertical Gó. The asymmetry index for horizontal Gó is the ratio of the right and left horizontal Gó lengths; the horizontal Gó length means the length from the midsagittal reference line to Gó (right and left). The asymmetry index for vertical Gó is the ratio of the right and left vertical Gó length; the vertical Gó length means the length from the horizontal reference line to Gó (right and left).
The SPSS software program (version 10.0, SPSS, Chicago, Ill) was used. One-way analysis of variance (ANOVA) was used to analyze the differences among the 3 groups. Bonferroni tests were performed for post-hoc analysis of the differences. The sex differences were examined with the Student t test.
Stepwise linear regression analysis was performed to determine the independent variables that were associated most closely with the assessment of facial asymmetry (dependent variables). The linear regression equation was:
where, α , β 1 , and β 2 … β k are constants, and X 1 , X 2 … , and X k are independent variables that are combined linearly to explain the variation in the dependent variable ( Y ).
Reliability was assessed by using duplicate measures on a subset of randomly selected photographs scored 2 weeks apart. Systemic error, assessed by comparing the mean differences between replicates to the standard error, was not statistically significant. The random technical error was calculated by using Dahlberg’s formula. The method error was <2.0° for all measurements except for ramus inclination difference, which was 2.5°.
Results
The patients were classified into 3 groups by using the assessment scores of facial asymmetry. Group I included patients with little or no facial asymmetry, not requiring treatment. Group II included patients with moderate facial asymmetry but not requiring treatment. Group III included patients with severe asymmetry, requiring treatment. One-way ANOVA showed that lip canting, chin deviation, body inclination difference, and gonial angle difference were significantly different between the groups. In group I, the mean scores of the factors for lip canting, chin deviation, body inclination difference, and gonial angle difference were 1.61°, 1.11°, 2.80°, and 2.31°, respectively. In group II, the mean scores were 2.29°, 2.00°, 3.75°, and 3.05°, respectively. In group III, the mean scores were 3.09°, 3.64°, 7.11°, and 6.14°, respectively ( Table IV ).
| Group I | Group II | Group III | P value | ||||
|---|---|---|---|---|---|---|---|
| Mean | SD | Mean | SD | Mean | SD | ||
| Eye canting | 1.48 | 0.93 | 1.47 | 1.15 | 1.55 | 1.05 | NS |
| Otobasion canting | 1.36 | 0.90 | 1.61 | 2.03 | 1.36 | 1.19 | NS |
| Lip canting | 1.61 | 1.12 | 2.29 | 1.47 | 3.09 | 2.31 | 0.00 ∗ |
| Gonial canting | 2.02 | 1.20 | 1.96 | 1.31 | 2.34 | 2.08 | NS |
| Nose deviation | 1.42 | 1.23 | 1.37 | 1.17 | 1.73 | 1.18 | NS |
| Chin deviation | 1.11 | 0.96 | 2.00 | 1.38 | 3.64 | 2.19 | 0.00 ∗ |
| Ramus inclination difference | 2.55 | 2.33 | 3.73 | 2.93 | 4.18 | 3.66 | NS |
| Body inclination difference | 2.80 | 1.90 | 3.75 | 2.53 | 7.11 | 4.86 | 0.00 ∗ |
| Gonial angle difference | 2.31 | 2.05 | 3.05 | 2.62 | 6.14 | 5.95 | 0.00 ∗ |
| Asymmetry index of H-Gó | 6.34 | 4.42 | 9.20 | 7.12 | 8.50 | 7.79 | NS |
| Asymmetry index of V-Gó | 5.78 | 3.53 | 5.30 | 3.58 | 6.68 | 6.17 | NS |
The sex differences were not significant statistically according to the Student t test. Chin deviation tendency of each group was evaluated in Table V .


